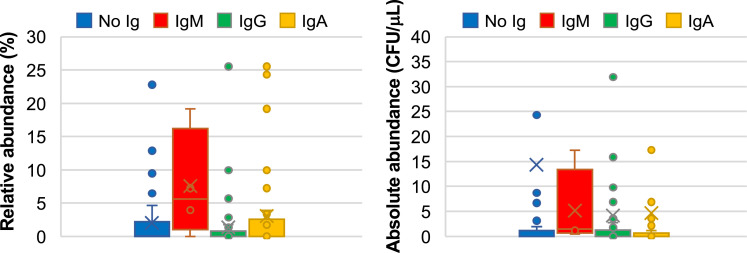
FIGURE 2.
Positive anti-CptA ELISA is not a good predictor of current S. vaginalis presence. ELISA data were used to categorize samples as anti-CptA positive (two OD450nm readings ≥0.05) or negative (one or zero OD450nm readings ≥0.05). The vaginal swab samples were grouped as positive or negative for IgM, IgG, or IgA. Samples that contained anti-CptA Abs of more than one isotype are represented multiple times in the plots. Box-and-whisker plots show range, outliers, means (X), and the median (line). The y-axis indicates relative abundance determined by 16S rRNA survey or absolute abundance determined by qPCR.

