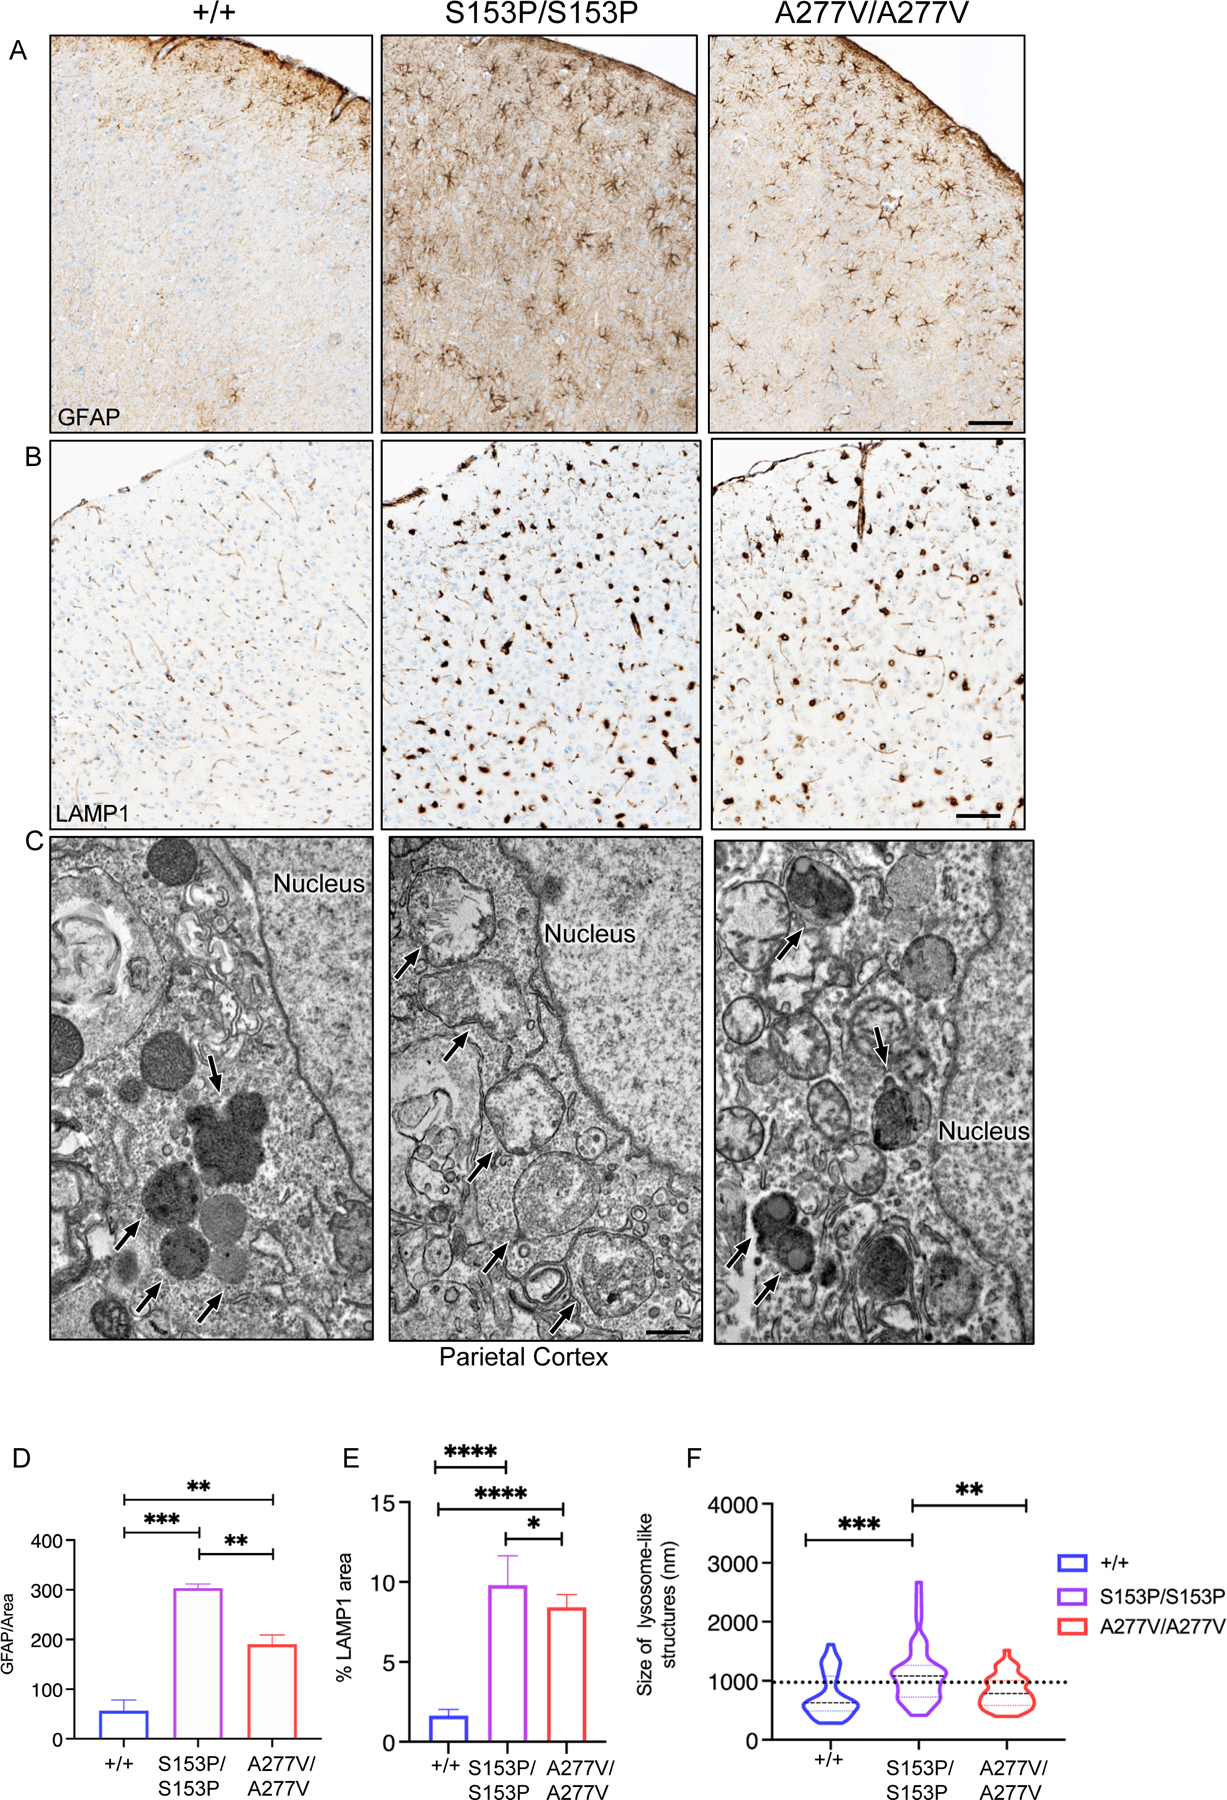
Figure 5. Brains of Sumf1S153P/S153P and Sumf1A277V/A277V mice.

Representative GFAP (A) and LAMP1 (B) immunohistochemistry and EM (C) of brains from 24–week-old Sumf1S153P/S153P (S153P/S153P) and Sumf1A277V/A277V (A227V/A227V) mice compared to Sumf1+/+ (+/+) controls. LAMP1 immunohistochemistry, magnification: 10x scale bar, 20 μm. GFAP immunohistochemistry, magnification: 10x scale bar, 50 μm. In C, the back arrows point to lysosomal-like structures; scale bar: 500 nm. (D) Quantifications of GFAP and LAMP1 area over total area shown as mean ± SEM (WT n=4, S153P n=4, A277V n=4). One-way ANOVA followed by Tukey’s post hoc test; ****p<0.0001. (B2) ****p<0.0001.
