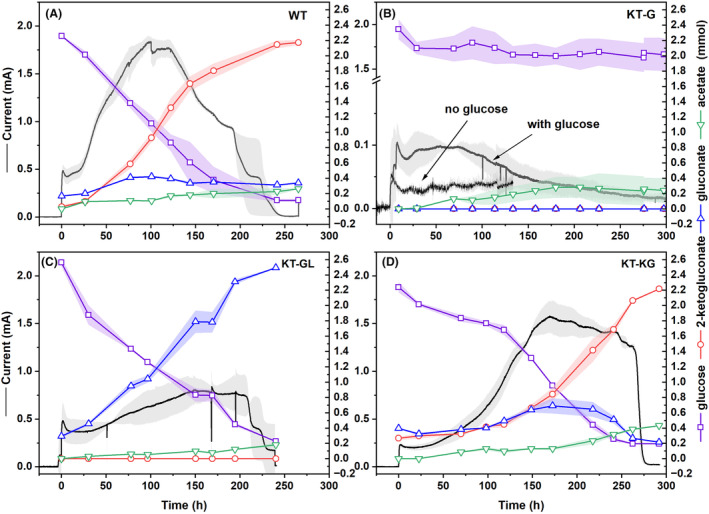
FIGURE 3.

Representative performance of P. putida KT2440 WT and the three gene deletion mutants in BES. Left y‐axis indicates the current output of the respective BES fermentations, and the right y‐axis shows the quantity of metabolites (mmol) in the reactors. Due to the low sugar consumption by the KT‐G mutant, a control experiment without glucose was conducted to check the current response from carbon carry‐over originating from the preculture. The line or line‐symbol presents the averaged values and the shading indicates the standard deviations of biological replicates.
