
FIGURE 5.
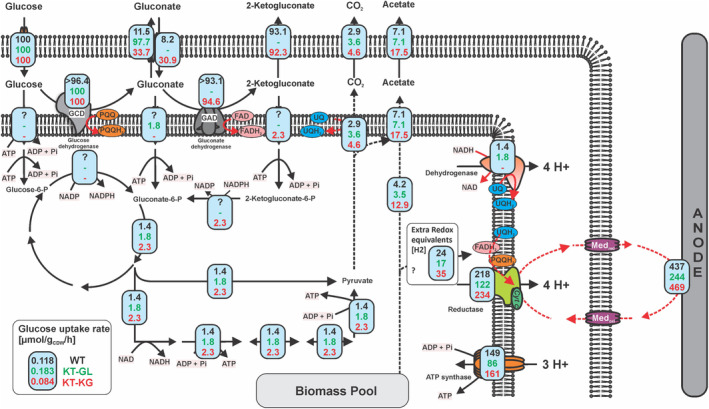
Flux balance analysis maps for the P. putida KT2440 wild type (black number), KT‐GL (green number) and KT‐KG (red numbers) strains in BES. Fluxes are normalized to the glucose uptake rate given in [mmol/gCDW/h] and calculated based on Supplementary Table S2. The fluxes through acetate and CO2 were estimated based on the 13C enrichment and on the assumption that cytoplasmic oxidation of sugar to acetate will release stoichiometric amounts of CO2, while degradation of storage carbon (e.g. poly‐hydroxybutyric acid) might not. The ATP rate was calculated based on the stoichiometric balance, considering the proton pumping effect of dehydrogenase and membrane reductase. In addition, the charge balance that one electron transferred to the anode would take away one proton from the periplasm to the extracellular space. Three protons are assumed to be needed for the synthesis of one ATP molecule. The ‘?’ in the flux indicates the uncertainties of the flux balance analysis, as it was unable to resolve the exact cross‐membrane flux for the WT. Here we assumed it followed the periplasmic oxidative pathway and then cytosolic glycolysis. The ‘‐’ means the respective pathway was metabolically not possible. ‘>’ means a minimum flux is given. Also, a mismatch between anodic electrons and predicted reductase activity (2 electron process) could point towards some redox equivalents originating from the biomass pool as well.