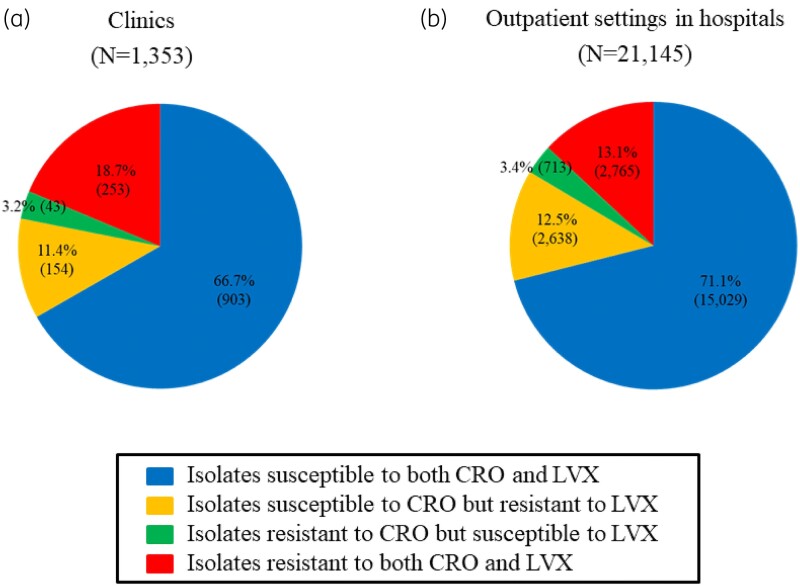
Figure 3.
Pie charts of bacteraemic patients with E. coli isolates tested with two drugs [ceftriaxone (CRO) and levofloxacin (LVX)] categorized into four types according to the results of antimicrobial susceptibility to both drugs between (a) clinics (0–19 beds) and (b) outpatient settings in hospitals (≥20 beds) in 2018. The total number of bacteraemic E. coli patients with isolates tested with both drugs stratified by type of medical facility did not include those with isolates that were neither susceptible nor resistant to both drugs. The blue portion of the pie chart indicates the isolates that were susceptible to both CRO and LVX. The yellow portion represents isolates susceptible to CRO but resistant to LVX. The green portion indicates the isolates resistant to CRO but susceptible to LVX. The red portion represents isolates resistant to both CRO and LVX. The percentage of bacteraemic patients with each of the four types of E. coli isolates is shown in the pie chart along with the number of patients.

