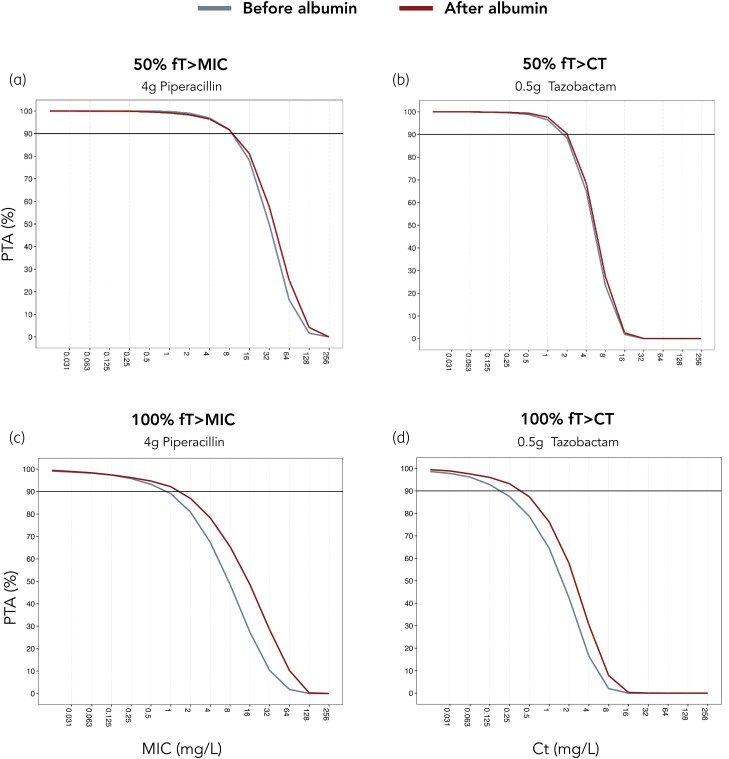
Figure 2.
PTA plots for 0.5 h infusion of 4.5 g piperacillin/tazobactam q8h under steady-state conditions. (a) PTA of piperacillin for 50% fT>MIC, (b) PTA of tazobactam for 50% fT>Ct, (c) PTA of piperacillin for 100% fT>MIC and (d) PTA of tazobactam for 100% fT>Ct. Comparison between concentrations before albumin supplementation (grey lines) and after albumin supplementation (red lines) with simulated (n = 500) piperacillin/tazobactam concentrations. Horizontal lines denote breakpoints of 90% PTA. This figure appears in colour in the online version of JAC and in black and white in the print version of JAC.

