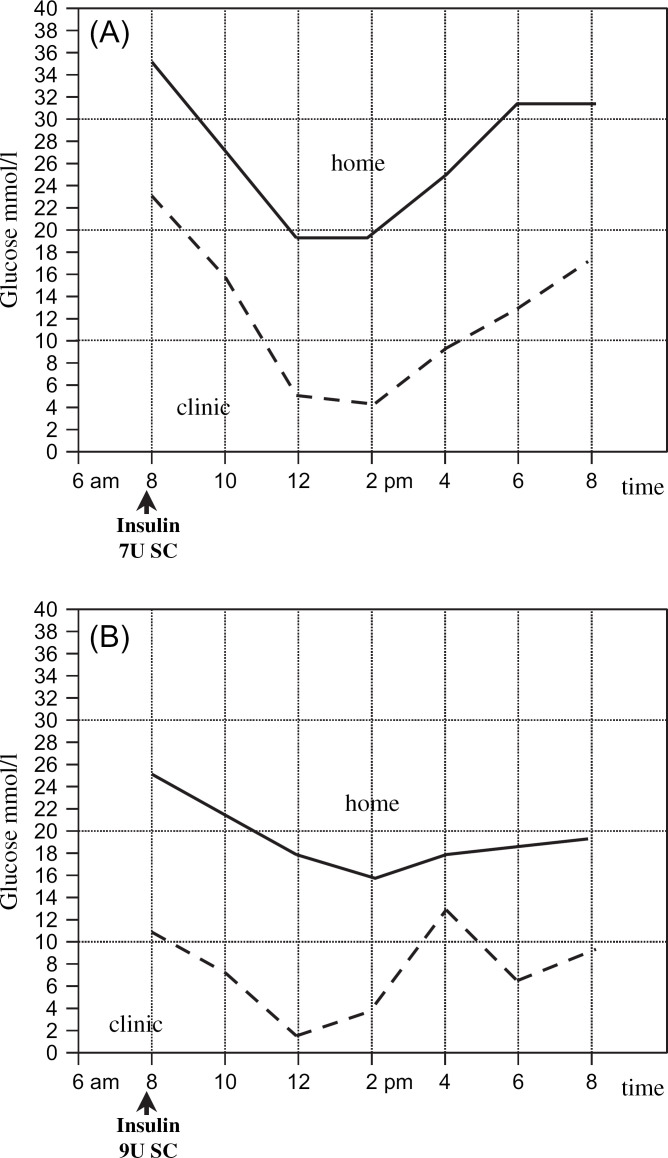
Fig 4.
Two blood glucose curves (BGCs), generated either at home (broken line) or in the clinic (solid line) in a 7-year-old, weighing 7.6 kg, castrated male, domestic shorthair cat. For each BGC, the blood glucose concentration was measured before and every 2 h after administration of insulin during a 12-h period for a total of seven measurements. The two BGCs, generated within one day of each other, differ. (A) Third re-evaluation. The cat is on 7 IU Caninsulin bid and still showed polydipsia and polyuria. The home BGC has a nadir of 19.9 mmol/l, which is too high, and thus, an increase in the insulin dosage would be advised. The hospital BGC has a nadir of 4.1 mmol/l, which is considered borderline, and a reduction in the insulin dosage might be advised. The final decision was based on the home curve and the insulin dosage was increased to 9 IU bid. (B) Forth re-evaluation. The cat is on 9 IU Caninsulin bid. Polydipsia and polyuria are still present but have improved. The home BGC had a nadir of 15.6 mmol/l and the hospital BGC a nadir of 1.6 mmol/l. Based on the hospital and home curves, the insulin dosage would be reduced and increased, respectively. The insulin dosage was kept unchanged and the owner was asked to generate another BGC a week later. The low glucose nadirs in the hospital BGC were attributed to decreased food intake during hospitalisation. The home BGC one week later (not shown) had again a nadir >9 mmol/l and the owner increased the insulin dosage to 10 IU bid. Since then the cat is doing well and clinical signs have markedly improved.

