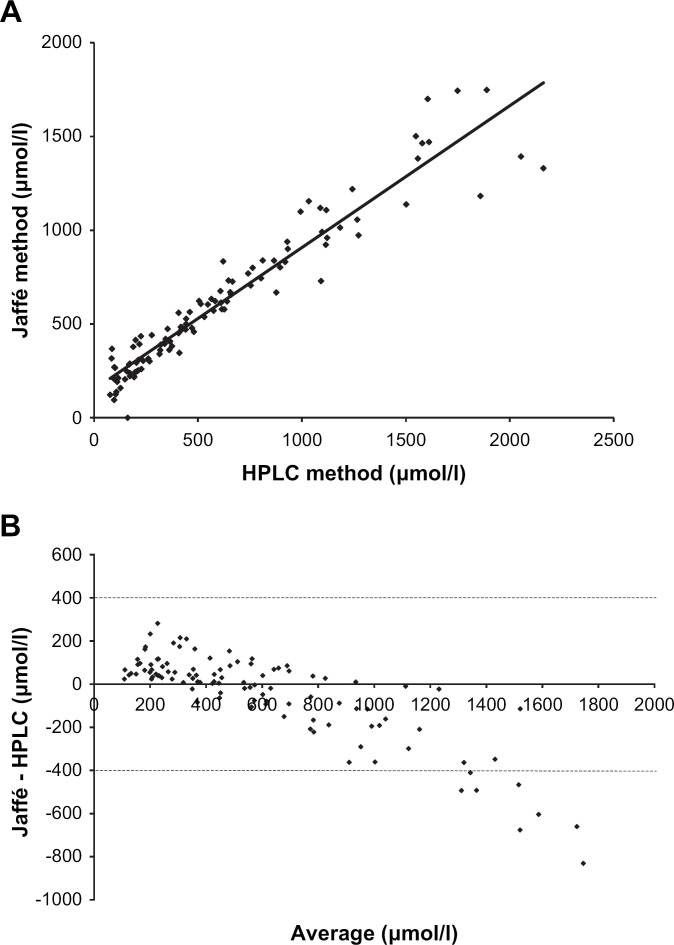
Fig 2.
(A) Plasma creatinine concentrations assayed by Jaffé method plotted against the plasma creatinine concentrations assayed by the HPLC method. The linear regression equation was y=0.756x+151.43 (r2=0.92). The plasma creatinine values were observed in 12 cats following intravenous bolus administration of exogenous creatinine at a dose level of 40 mg/kg. (B) Bland–Altman plot of the differences between plasma creatinine assayed using the Jaffé and the HPLC methods against the average value for each plasma creatinine concentration. The plasma creatinine values were observed in 12 cats following intravenous bolus administration of exogenous creatinine at a dose level of 40 mg/kg. The dotted lines represent the mean difference plus and minus 1.96 times the standard deviation of the differences.

