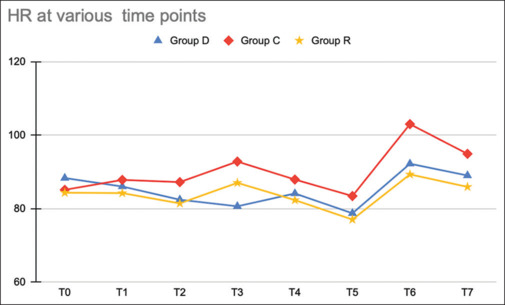
Figure 1.

Line diagram showing heart rate among the three groups at various time points (T0—before nebulization, T1—immediately after nebulization, T2—before intubation, T3*—immediately after intubation, T4—5 mins after intubation, T5—at the end of surgery (closure of skin incision), T6*—immediately after extubation, and T7*—5 minutes after extubation). (P value was significant at T3 (P < 0.0001), T6 (P < 0.0001), and T7 (P < 0.005))
