
Figure 2.
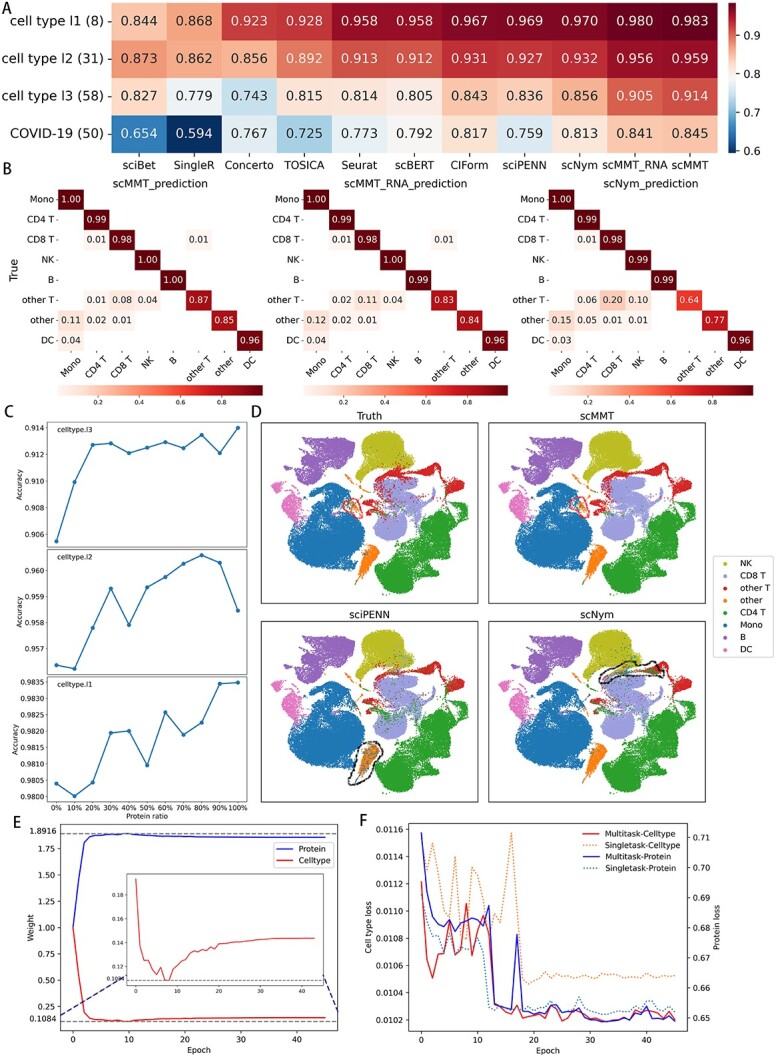
scMMT achieves superior performance in cell type annotation. (A) Heatmap depicts the accuracy of cell type annotation. The rows are labeled as cell type l1, cell type l2, cell type l3 and COVID-19 corresponding to the three levels of annotation in the 160k PBMCs dataset and COVID-19 dataset. The numbers in parentheses (8, 31, 58 and 50) indicate the number of cell types in each dataset. (B) Heatmaps display the distribution of eight cell type labels predicted by scMMT, scMMT_RNA and scNym (the three methods with the highest accuracy) in the 160k PBMCs dataset. The data were normalized within each row based on the true labels, and only values greater than 0.01 were labeled. (C) Line charts depict the impact of protein information proportions on cell type annotation using scMMT. We analyzed three levels of cell annotation in the 160k PBMCs dataset and extracted protein expression data in increments of 10%. (D) UMAP plots display the true and predicted eight cell type labels using scMMT, sciPENN and scNym in the 160k PBMCs dataset. Red lines represent cell types that were challenging to identify using other methods but were accurately predicted using scMMT. Conversely, black lines indicate cell types where a specific method had a higher error rate compared to other methods. (E) The weight changes of cell type annotation and protein prediction tasks during scMMT training on cell type l3 level using the 160k PBMCs dataset. (F) The line graph shows the loss changes of cell type annotation and protein prediction tasks on each epoch of single-task learning and multi-task learning models trained using scMMT on the 160k PBMCs dataset.