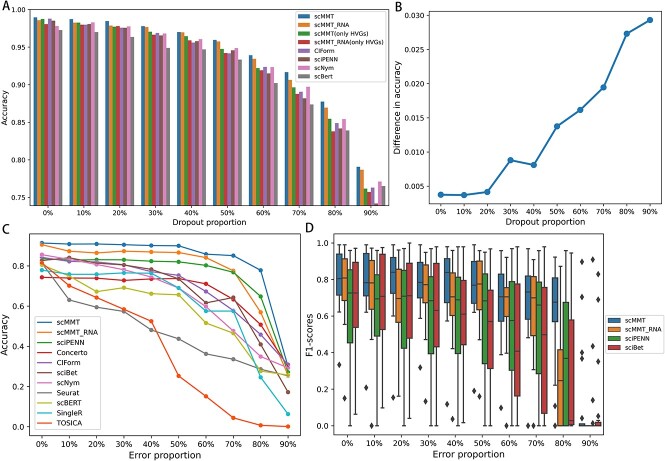
Figure 4.
scMMT exhibits robustness against noise arising from incorrect cell type labels. (A) Bar chart shows the changes in accuracy of cell type annotation using different methods as additional dropout noise is continuously added to the simulation dataset. (B) Line graph illustrates the difference in average accuracy for cell type annotation between scMMT/ scMMT_RNA using multiple feature extraction methods and scMMT(only HVGs)/scMMT_RNA(only HVGs) using only highly variable genes. (C) Line graph displays the changes in prediction accuracy for all nine methods as a proportion of erroneous cell type labels was intentionally introduced in cell type l3 level of 160k PBMCs dataset. (D) Box plot displays the F1 scores of scMMT, scMMT_RNA, sciPENN and sciBet, which are the top four methods to resist label noise, for annotating rare cell types of cell type l3 level in the 160k PBMCs dataset.

