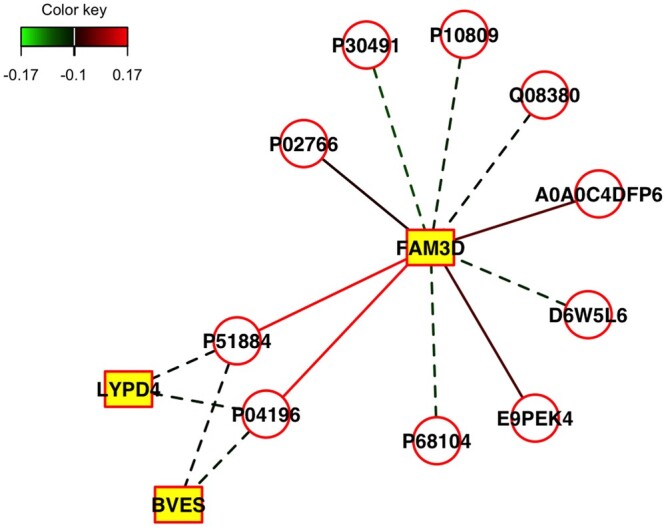
Figure 3.

Relevance network plot for SIDA. The nodes of the graph represent variables for the pairs of views, and edges represent the correlations between pairs of variables. Dashed and solid lines indicate negative and positive correlations, respectively. Circle nodes are View 1 variables (proteins), and rectangular nodes are View 2 variables (genes). We show edges with correlations at least 0.1. The plot suggests that the gene FAM3D is negatively correlated with many proteins (e.g. PO2766, P30491, Q08380), and positively correlated with proteins such as A0ADC4DFP6, E9PEK4, P04196, and D6W5L6.
