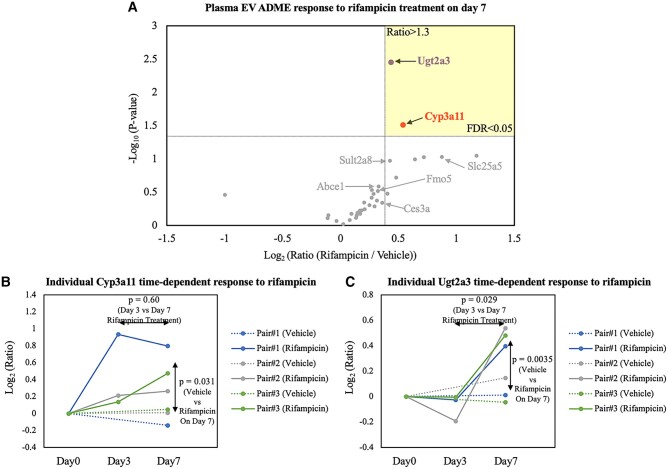
Fig. 5.
Drug-stimulation time-dependent response in plasma EVs. A) Volcano plot highlighting comparative ADME response to rifampicin treatment on day 7. Among various ADME proteins, Cyp3a11 and Ugt2a3 in plasma EVs emerged with the most consistent and significant induction (FDR < 0.05), from three pairs of biological replicates. Response of B) Cyp3a11 and C) Ugt2a3, respectively, to rifampicin along 7-day treatment was illustrated individually and P-values of treatment response were plotted at designated positions.

