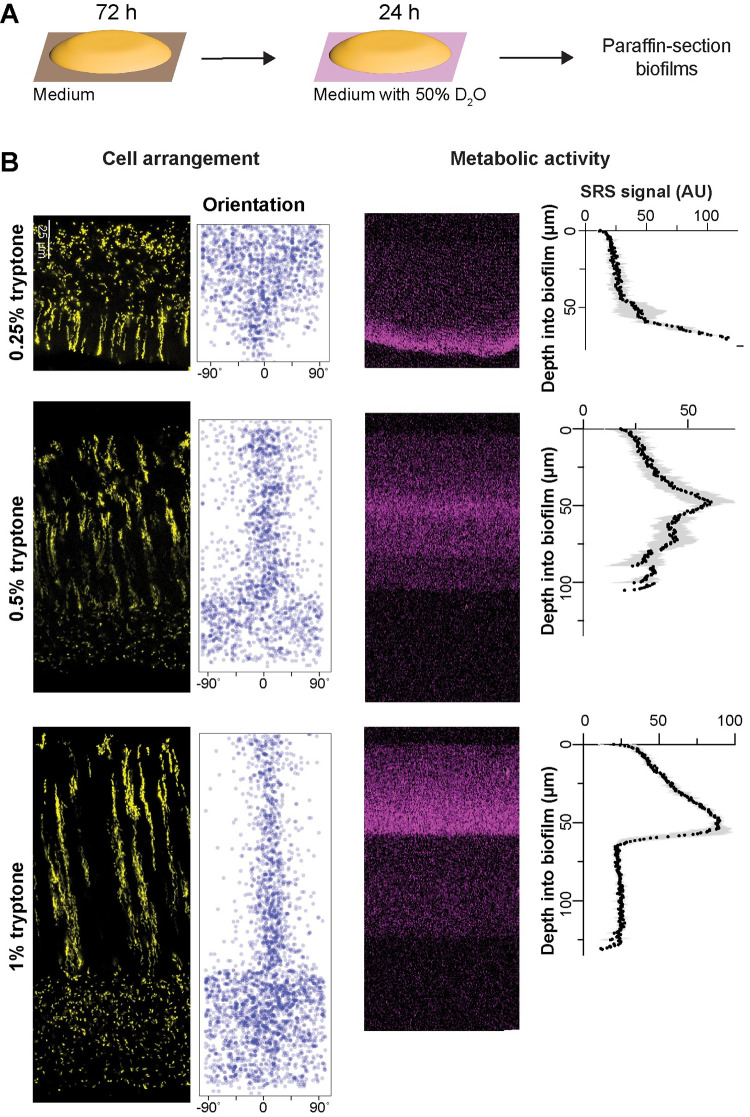
Fig 2. Resource availability affects the organization of cellular arrangement zones and metabolic activity in biofilms.
(A) Experimental setup for growing P. aeruginosa biofilms on agar plates and their subsequent transfer to medium containing D2O for analysis of metabolic activity by SRS microscopy. (B) Left: Fluorescence micrographs and quantification of cellular orientation across depth for thin sections from mixing-assay biofilms grown on different concentrations of tryptone. Scale bar applies to all images. Right: SRS microscopy images and SRS signal across depth for thin sections from mixing-assay biofilms grown on different concentrations of tryptone. SRS signal represents the average of 3 biological replicates with shading indicating the standard deviation. The data underlying this figure can be found in S1 Data.

