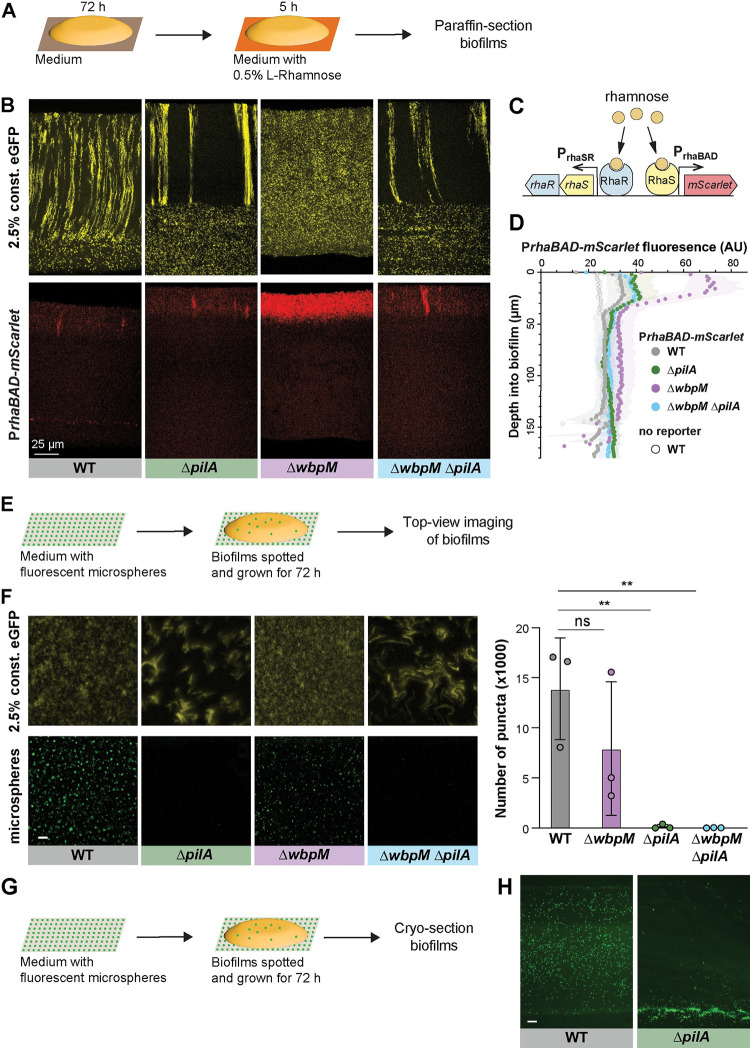
Fig 6. Cellular arrangement affects the uptake of substrates into colony biofilms.
(A) Schematic illustration of the experimental setup for growing P. aeruginosa biofilms on agar plates and their subsequent transfer to medium containing L-rhamnose. (B) Fluorescence micrographs of thin sections from WT and indicated mutant biofilms. Biofilm inocula contained 2.5% cells that constitutively express eGFP and 97.5% RhaSR-PrhaBAD-controlled mScarlet-producing strain. Top panels show eGFP fluorescence (colored yellow) and bottom panels show the mScarlet fluorescence for each thin section. Scale bar applies to all images. (C) Schematic of RhaSR-PrhaBAD expression system driving mScarlet production. (D) Quantification of mScarlet fluorescence shown in (B). Shading represents standard deviation of biological triplicates. (E) Schematic of the experimental setup for growing P. aeruginosa macrocolony biofilms on agar plates with fluorescent microspheres (200 nm). (F) Left: Top-view images taken from center of macrocolony biofilms that were grown on medium with microspheres (colored green). Biofilms contained 2.5% cells constitutively expressing eGFP (colored yellow). Scale bar is 25 μm and applies to all images. Right: Quantification of microspheres visible in top-view images. Each data point is a biological replicate, bar height indicates the mean of these replicates; p values are based on two-sided unpaired t tests (n.s., not significant; ** p ≤ 0.01). (G) Schematic illustration of the experimental setup for growing biofilms on agar plates with fluorescent microspheres for cryosectioning. (H) Fluorescence micrographs of cryosections of biofilms grown on microspheres (colored green). Scale bar is 25 μm and applies to both images. The data underlying Fig 6D and 6F can be found in S1 Data.

