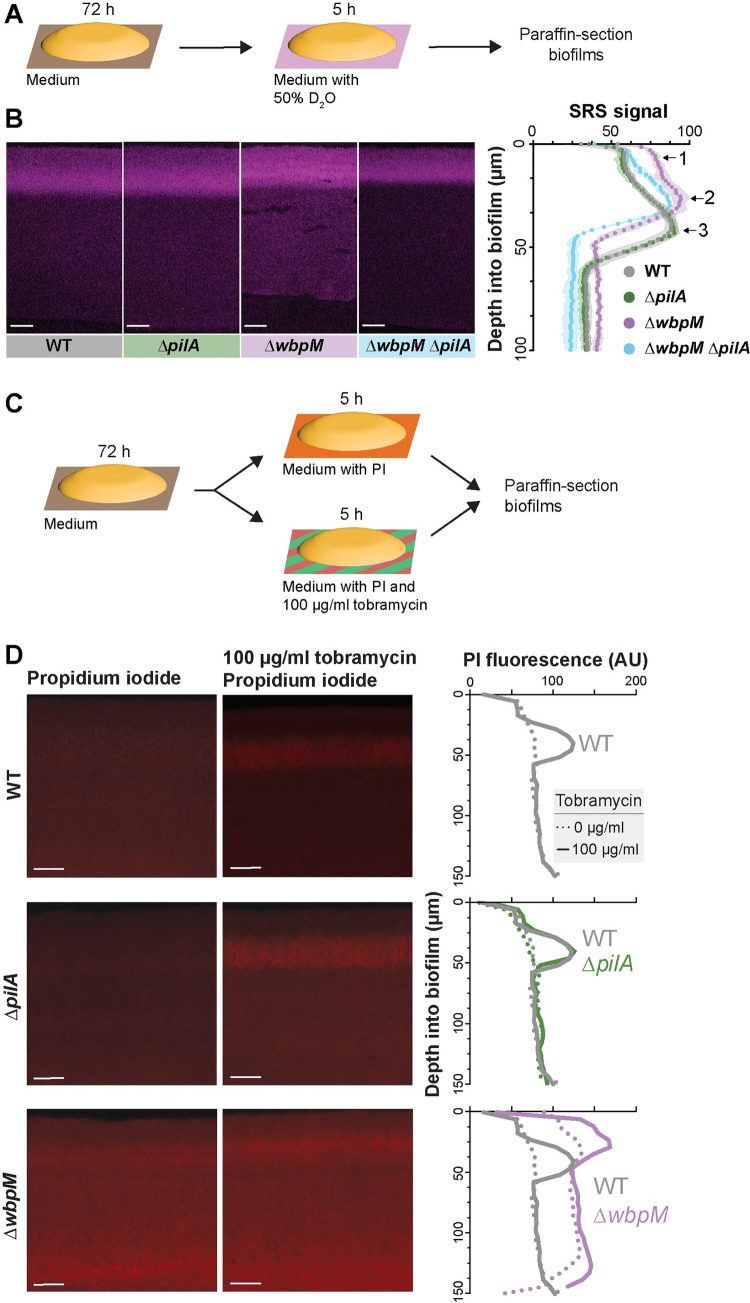
Fig 7. Mutations affecting cellular arrangement alter metabolic activity and antibiotic tolerance profiles within biofilms.
(A) Schematic illustration of the experimental setup for growing biofilms on agar plates and their subsequent transfer to a medium containing D2O for analysis of metabolic activity using SRS microscopy. (B) Left: SRS micrographs of WT and mutant biofilm thin sections. Right: Graph showing the quantitative shift in metabolic activity distribution in different mutants. (C) Schematic illustration of the experimental setup for growing biofilms on agar plates and their subsequent transfer to a medium containing propidium iodide or propidium iodide + tobramycin (D) Left: Fluorescence micrographs of three-day-old biofilms exposed to PI. Center: Fluorescence micrographs of biofilms treated with tobramycin and PI. Right: Graphs showing quantification of PI staining. Images are representative of at least 2 independent experiments. (B, D) Scale bars are 25 μm. The data underlying Fig 7B and 7D can be found in S1 Data.

