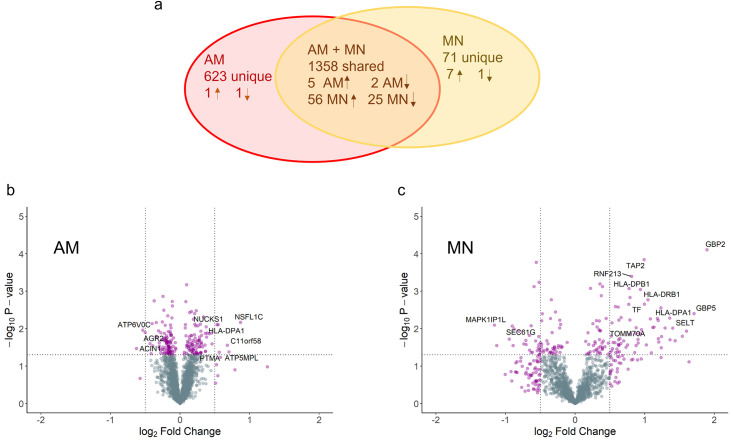
Fig 3. IFN-γ stimulation of AM and MN cells for 16–24 hours results in a larger number and percentage of differentially abundant proteins in MN relative to AM.
a) Venn diagram with the number of proteins discovered within and across both cell types and the number of proteins up- and down-regulated based on p-value < 0.05 and absolute value fold change (FC) > 0.5. b) MN and c) AM volcano plots showing the significance (-log10 p-value) vs the log2 fold change in protein abundance. Data reflect the results from paired MN and AM from 10 healthy adult volunteers.

