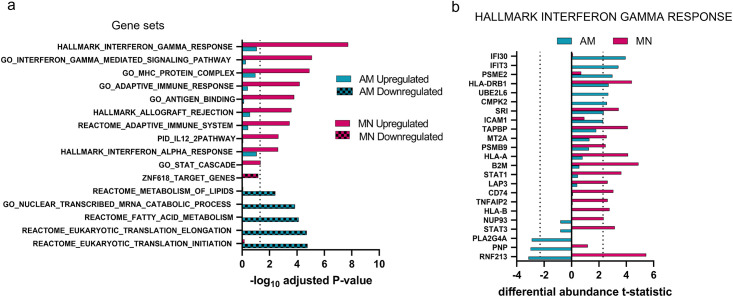
Fig 4. IFN-γ response signatures were significantly enriched with upregulated MN proteins in contrast to AM proteins which showed no significant upregulated enrichment.
a) AM and MN proteins were ranked based on the IFN-γ differential abundance effect size and analyzed for signature enrichment. Dotted line at 1.3 delineates enrichment scores with adjusted p-value < 0.05. b) AM and MN proteins within the most significantly enriched gene set, Hallmark Interferon Gamma Response, illustrate that more proteins in this set are differentially regulated in MN (14) relative to AM (6 upregulated, 3 downregulated). The x-axis shows the differential abundance t-statistic for each protein with dotted lines at significance level = 0.05.

