
Figure 1: Molecular Cytogenetic Techniques commonly used to quantify aneuploidy and large copy number variation.
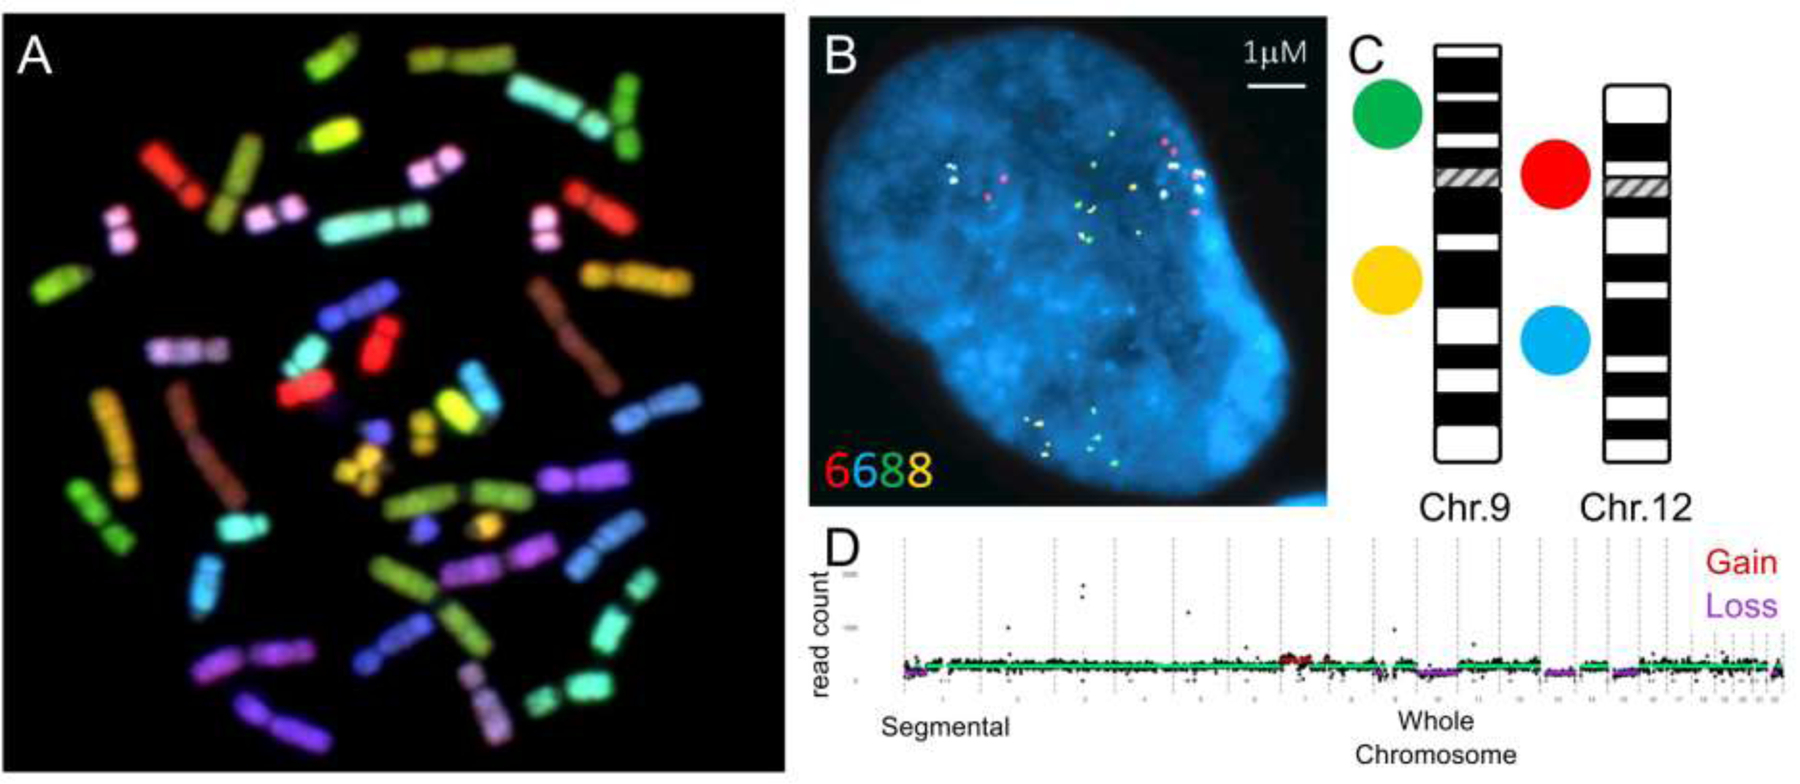
A) Spectral Karyotyping (SKY) image of metaphase chromosomes illustrating human chromosomes labeled with unique fluorophores or combinations. This allows the identification of all human chromosomes in a single image based on the emission spectra assigned to each autosome or sex chromosome1. B-C) Representative interphase nucleus analyzed using interphase FISH (iFISH) to quantify copy number changes to infer chromosome specific aneuploidies. Copy number alterations are determined by enumerating signals at locus-specific probes of interest. A 4-color iFISH approach is employed, utilizing 2-locus specific probes mapping to a single chromosome, which enable the measurement of aneuploidy events (C)2. D) Representative example of copy number estimates across the entire genome quantified by scL-WGS3. After normalizing mappability, GC content, and amplification bias, the results are presented as a copy number variation plot. Each black dot represents a genomic bin, while green horizontal lines indicate regions with 2 copies. Purple regions represent chromosome loss, and red regions represent chromosome gain. The plots were generated using Ginko4.