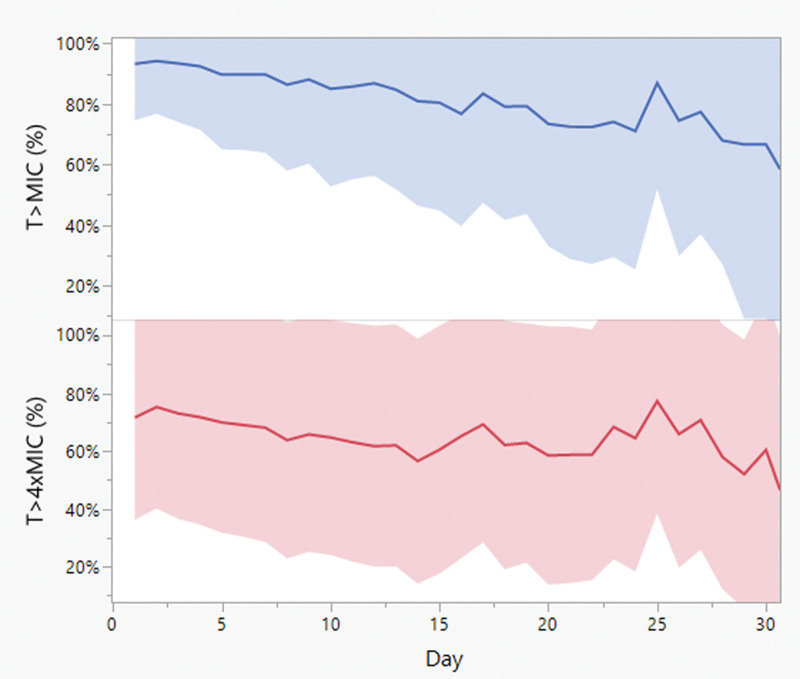
Figure 3.
Daily pharmacokinetic/pharmacodynamic target attainment. The solid line represents the mean and the band represents the sd. T>MIC and T>4×MIC = time the beta-lactam concentration was above the minimum inhibitory concentration or four multiples of the minimum inhibitory concentration, respectively.

