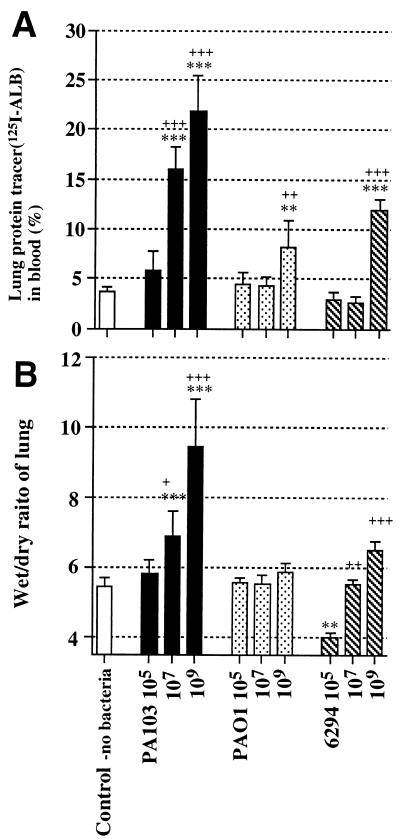
FIG. 2.
Measurement of lung epithelial damage and edema. Inocula (50 μl each) were prepared with no bacteria, PA103, PAO1, or 6294 at three different concentrations (105, 107, and 109 CFU/ml). An inoculum was instilled into one lung with a protein tracer consisting of 125I-labeled human albumin. (A) Lung protein tracer leakage into blood. (B) Wet/dry ratios of lungs 4 h after bacterial instillation. Data are means ± standard deviations (indicated by error bars). Plus signs indicate statistical significances of intragroup comparisons relative to the group treated with the lowest dose of the same bacteria (+, P < 0.05; ++, P < 0.01; +++, P < 0.001). Asterisks indicate statistical significances of comparisons between the experimental groups and the control group (∗, P < 0.05; ∗∗, P < 0.01; ∗∗∗, P < 0.001). Each group consisted of three to five mice. One-way analysis of variance and the Bonferroni test were used to determine statistical significances.

