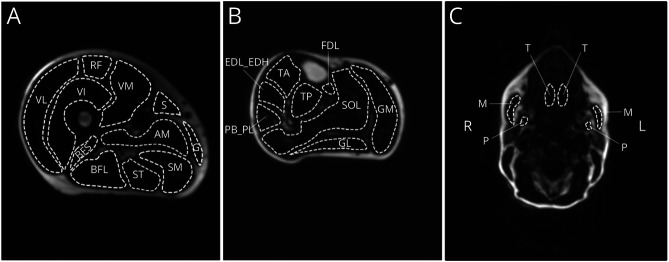
Figure 1. Typical Examples of a Dixon Fat Fraction Image of the Right Upper Leg, Right Lower Leg, and Head-Neck.
(A) Regions of interest per muscle of the upper leg. AM = adductor magnus; BFL = biceps femoris long head; BFS = biceps femoris short head; G = gracilis; RF = rectus femoris; S = sartorius; SM = semimembranosus; ST = semitendinosus; VI = vastus intermedius; VL = vastus lateralis; VM = vastus medialis. (B) Regions of interest per muscle of the lower leg. EDL_EDH = extensor digitorum/hallucis longus; FDL = flexor digitorum longus; GL = gastrocnemius lateralis; GM = gastrocnemius medialis; PB_PL = peroneus brevis and longus; SOL = soleus; TA = tibialis anterior; TP = tibialis posterior. (C) Regions of interest per muscle of the orofacial muscles. M = masseter, P = pterygoid medialis and T = tongue. R = right, L = left.

