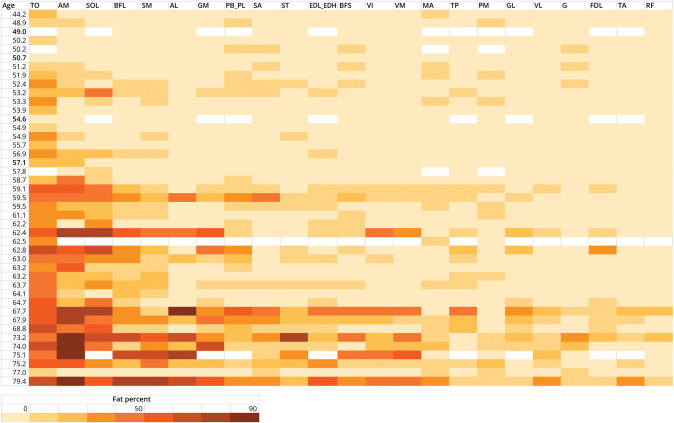
Figure 3. Heatmap Displaying the Pattern of Fatty Infiltration in OPMD at Baseline.
Each row represents a patient ordered by age. Each column represents a muscle ordered by the degree of fatty infiltration (mean fat fraction of left and right side). AL = adductor longus; AM = adductor magnus; BFL = biceps femoris long head; BFS = biceps femoris short head; EDL_EDH = extensor digitorum longus_extensor hallucis longus; FDL = flexor digitorum longus; G = Gracilis; GL = gastrocnemius lateralis; GM = gastrocnemius medialis; MA = masseter; PB_PL = peroneus brevis_peroneus longus; PM = pterygoid medialis; RF = rectus femoris; SA = sartorius; SM = semimembranosus; SOL = soleus; ST = semitendinosus; TA = tibialis anterior; TO = tongue; TP = tibialis posterior; VI = vastus intermedius; VL = vastus lateralis; VM = vastus medialis. White bar = no MRI scan due to technical errors or claustrophobia. Bold age = asymptomatic carrier.

