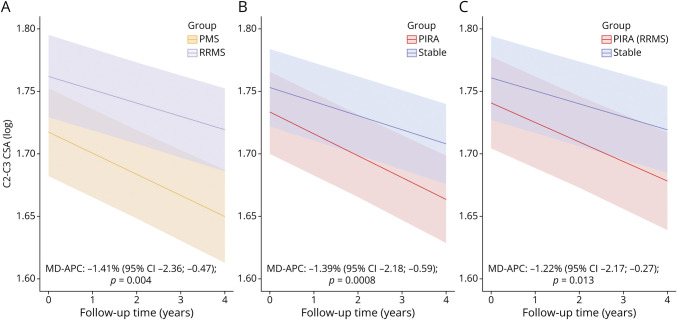
Figure 3. Group Comparisons of Spinal Cord Atrophy Rates.
(A) Patients with PMS vs patients with RRMS, (B) patients experiencing PIRA during follow-up vs stable patients, and (C) patients experiencing PIRA during follow-up vs stable patients, considering exclusively patients with RRMS at baseline. The figures display predicted marginal effects from the multivariable mixed models. CSA = cross-sectional area; MD-APC = mean difference in annual C2-C3 cross-sectional area percentage change; PMS = progressive multiple sclerosis; PIRA = progression independent of relapse activity; RRMS = relapsing-remitting multiple sclerosis.

