Figure 2.
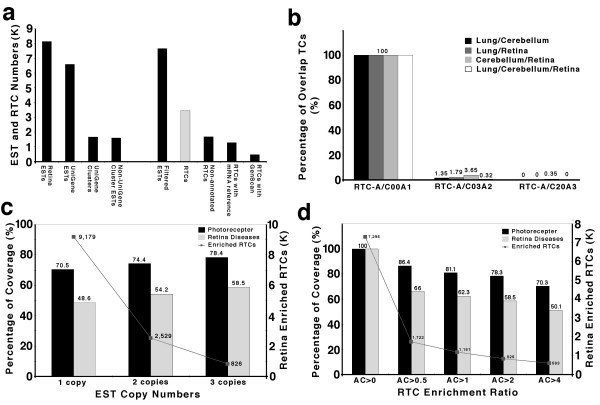
Purification and classification of mouse retina ESTs. (a) Distribution of retina ESTs in different categories. Total numbers of ESTs in mouse retina libraries; ESTs clustered by UniGene; Numbers of UniGene clusters; ESTs not clustered by UniGene; filtered ESTs for TC classification; retina transcript clusters (RTCs); Numbers of RTCs only represented in ESTs (non-annotated RTCs); Numbers of RTCs represented in mRNA references; and Numbers of RTCs represented in GenScan. (b) The percentage of overlap UniGene clusters between two different tissues or among three different tissues at distinct subtraction grades. (c and d) The coverage rates of known retina disease genes in retina libraries at different EST copy numbers and distinct subtraction grades. photoreceptor, photoreceptor related genes; Retina diseases, known retina disease genes; Enriched RTCs, retina specific and enriched RTCs.

