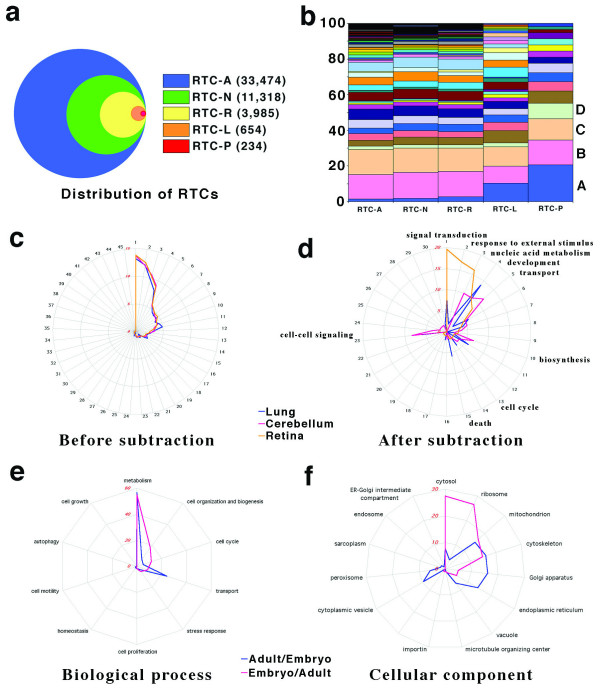
Figure 4.
GO analysis before and after RTC subtraction. (a) Distribution of RTCs in distinct categories (details described in text). (b) Functional annotation in distinct categories. A, perception of external stimulus; B, nucleobase, nucleoside, nucleotide and nucleic acid metabolism; C, protein metabolism and modification; D, carbohydrate metabolism; E, ion transport; F, protein transport; G, organogenesis; H, catabolism; I, biosynthesis; J, electron transport; K, energy pathways; L, amino acid and derivative metabolism; M, cytoplasmic transport; N, phosphate metabolism; O, hydrogen transport. (c and d) Subcategories of Biological Process category Functional clusters of TCs in lung (blue line), cerebellum (red line), and retina (yellow line) before (C) and after (D) subtraction. (e and f) Functional clusters of RTCs enriched in adult (blue line) or in embryonic phase (red line). Subcategories of Biological Process category (E) and of Cellular Component category (F).

