Figure 5.
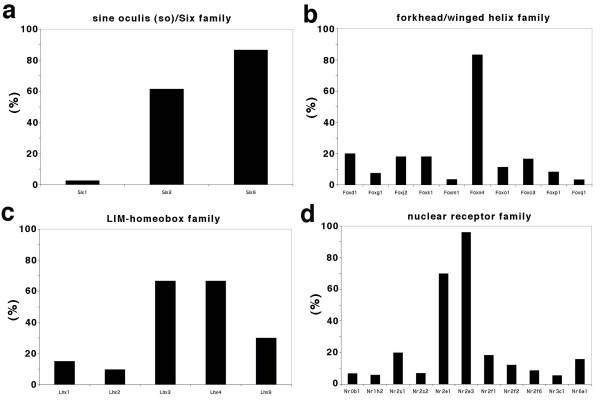
Distribution of enriched RTCs in gene families. (a) The percentage of enriched RTCs of sine oculis (so)/Six family in retina. (b) The percentage of enriched RTCs of forkhead/winged helix family in retina. (c) The percentage of enriched RTCs of LIM-homeobox family in retina. (d) The percentage of enriched RTCs of nuclear receptor family in retina.

