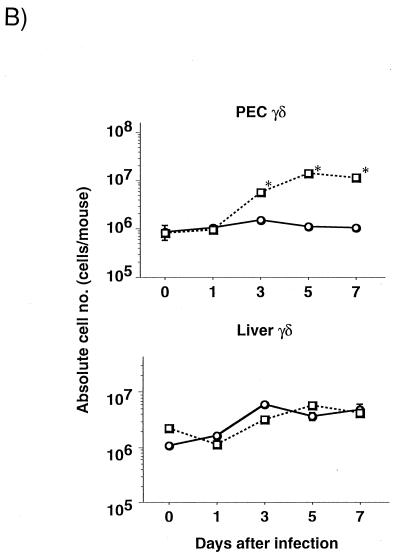
FIG. 2.
Kinetics of peritoneal γδ T cells after i.p. E. coli inoculation. C3H/HeJ or C3H/HeN mice were inoculated with 108 CFU of E. coli (one-fifth the LD50) on day 0. (A) Non-plastic-adherent PEC were stained with anti-CD3ɛ and anti-TCR-γδ MAbs. The number in each panel indicates the percentage of γδ T cells in whole nonadherent peritoneal cells. (B) Kinetics of the absolute numbers of peritoneal and liver γδ T cells after i.p. inoculation with E. coli. ○, C3H/HeJ mice; □, C3H/HeN mice. The number of γδ T cells was calculated from the percentage of the cells among nonadherent PEC or liver lymphocytes. Means and standard errors for five mice are shown. Asterisks indicate significant differences from the values for C3H/HeJ mice (P < 0.05).


