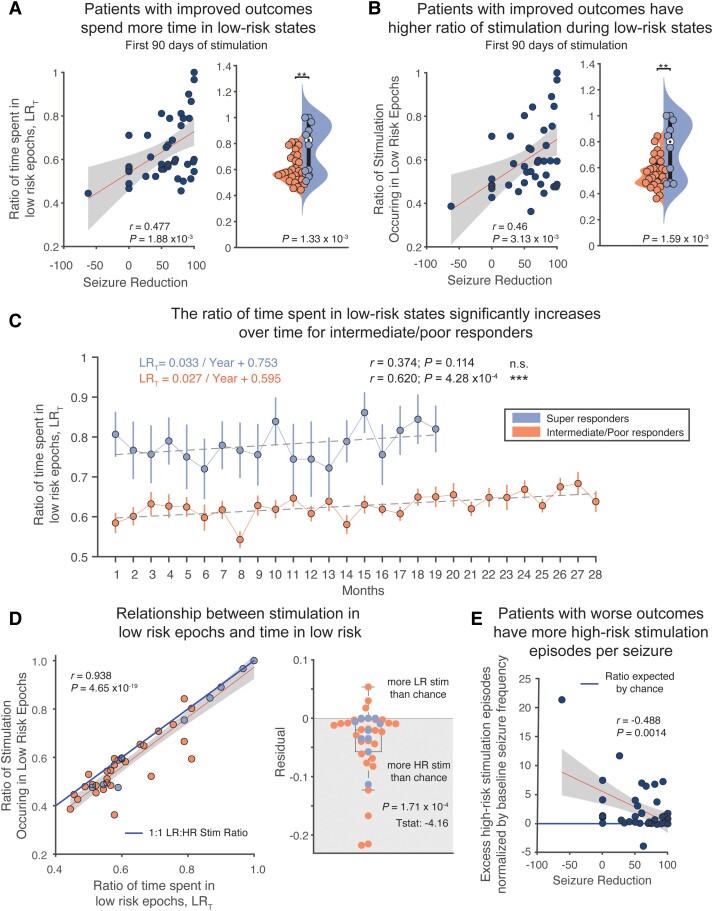
Figure 3.
Increased time spent in low-risk epochs and more stimulation occurring during low-risk epochs is predictive of clinical outcomes. (A) Patients with greater seizure reduction spend a greater amount of time in low-risk (LR) states (Pearson's correlation; r = 0.477, R2 = 0.227, P = 1.88 × 10⁻³). This analysis holds up to leave-on-out cross-validation (Pearson's correlation; P = 0.011). Super-responder patients spend significantly more time in low-risk states than high-risk (HR) states in the first 3 months of stimulation (two-sample t-test, P = 1.33 × 10⁻³). (B) Patients with greater seizure reduction also experience more stimulation during low-risk epochs (Pearson's correlation; r = 0.456, R2 = 0.208, P = 3.13 × 10⁻³). This analysis also holds up to leave one out cross-validation (Pearson's correlation; P = 0.019). Super-responder patients receive significantly more stimulation during low-risk states than high-risk states in the first 3 months of stimulation (two-sample t-test, P = 1.59 × 10⁻³). (C) Tracking time in low-risk states over the course of stimulation, we found that the ratio of time in low-risk states increases significantly over time for intermediate/poor responders (Pearson's correlation: r = 0.620, R2 = 0.385, P = 4.28 × 10⁻⁴). Despite this, after nearly 2.5 years, intermediate/poor responders have not yet reached the ratio of time in low risk that super-responders began at. (D) A and B are highly correlated (Pearson's correlation; r = 0.938, R2 = 0.880, P = 4.65 × 10⁻¹⁹). Compared to the solid blue line, which indicates a perfect balance between high-risk and low-risk stimulation, most RNS system patients have more high-risk stimulation than chance (one sample t-test; P = 1.71 × 10⁻⁴). (E) Having more high-risk stimulation episodes per seizure than chance correlates with poor clinical outcomes (Pearson's correlation; r = 0.488, R2 = 0.238, P = 1.4 × 10⁻³). n.s. = not significant.

