Figure 3.
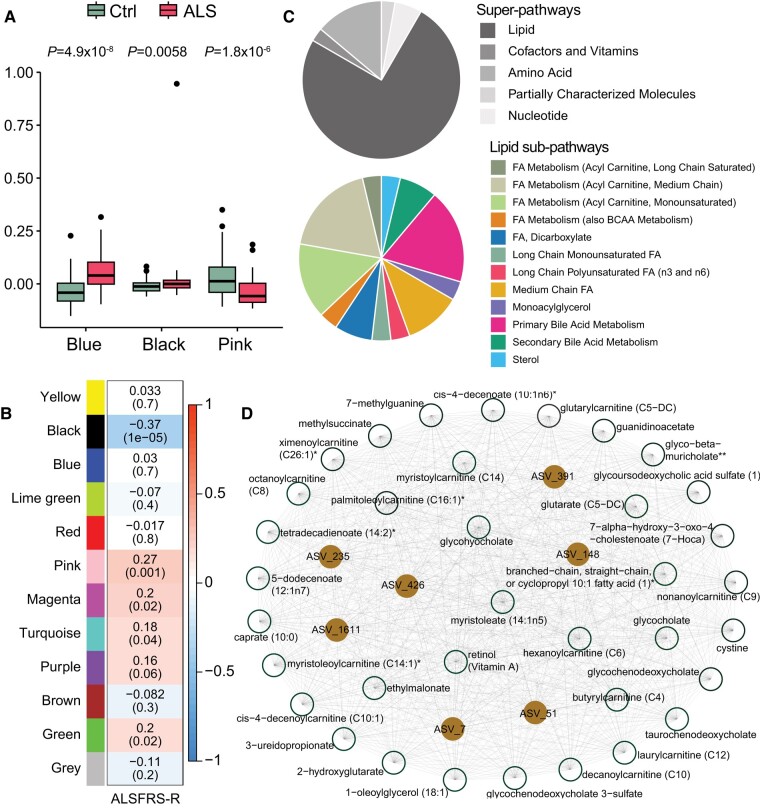
Lipids and ASVs cluster in ALS. (A) Blue, black and pink module expression differed significantly in amyotrophic lateral sclerosis (ALS) cases versus controls (Ctrl), represented by box plots, by Wilcoxon test. (B) Correlation of module colour (P-value in brackets) to functional status of ALS cases, assessed by ALSFRS-R (ALS Functional Rating Scale-Revised); gradient colour scale shows correlations to ALSFRS-R; significant correlations assessed by Pearson correlation. (C) Pie chart of black module metabolites by super-pathway (top) and lipid sub-pathway (bottom) membership. (D) Black module network plot of ASVs (brown circles) connected to metabolites (white circles), generated by Cytoscape. Metabolite membership to super-pathway and sub-pathway outlined in Supplementary Table 2. FA = fatty acid. *A compound that has not been confirmed based on a standard, but that the analytical platform is confident in its identity. **A compound for which a standard is not available, but that the analytical platform is reasonably confident in its identity or the information provided. ASV = amplicon sequence variant.

