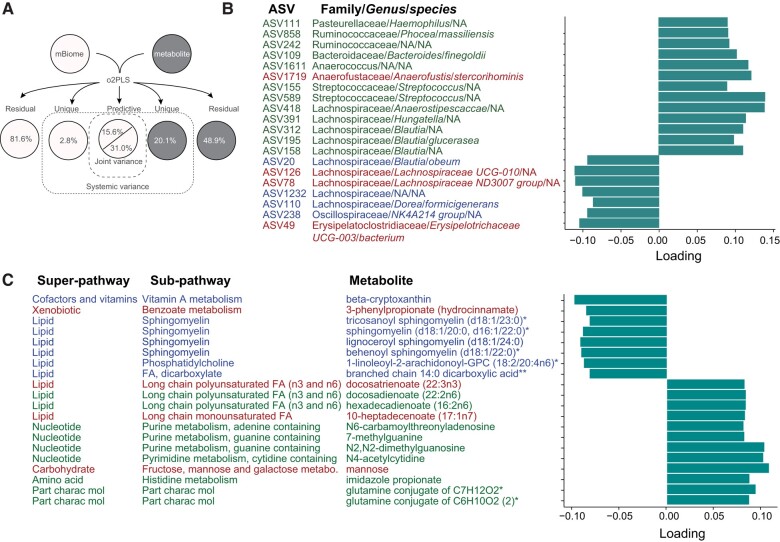
Figure 4.
Lipids are inter-correlated with ASVs in ALS. (A) Schematic overview of two-way orthogonal partial least square (O2PLS) integrative analysis showing structure model and corresponding percent of total variance explained by a total of 10 components. Joint variance analysis identified the top 20 highly inter-correlated (B) ASVs and (C) metabolites. ASVs annotated with Family/Genus/species, green font represents positively correlated with metabolites, blue font represents negatively correlated with metabolites, red font represents ASVs contributing to ALS versus control group separation (Fig. 5B). Metabolites annotated with super-pathway and sub-pathway, green font represents positively correlated with ASV, blue font represents negatively correlated with ASVs, red font represents metabolites contributing to ALS versus control group separation (Fig. 5C). FA = fatty acid; NA = not applicable (not identified to the genus and/or species level); part charac mol = partially characterized molecules. *A compound that has not been confirmed based on a standard, but that the analytical platform is confident in its identity. **A compound for which a standard is not available, but that the analytical platform is reasonably confident in its identity or the information provided. ASV = amplicon sequence variant.

