Figure 5.
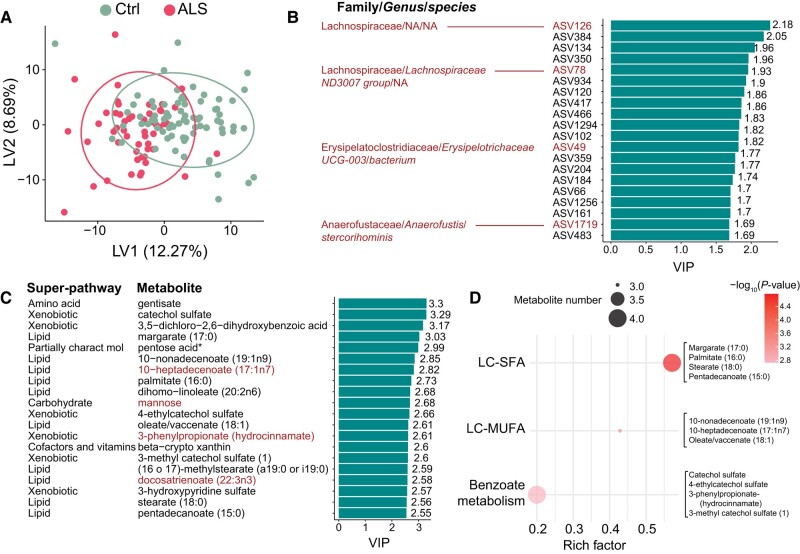
Lipids and ASVs separate ALS cases from controls. (A) Partial least squares derivative analyses (PLS-DA) score plot separates ALS cases from controls (Ctrl). Top 20 (B) amplicon sequence variants (ASVs) and (C) metabolites contributing to the separation of amyotrophic lateral sclerosis (ALS) cases from controls, as assessed by variable importance in projection (VIP) score plot. ASVs and metabolites present in the joint variance analysis are indicated by red font (Fig. 4), suggesting strong biomarker candidates. ASVs in red font annotated with Family/Genus/species. All metabolites annotated with super-pathway. (D) Dot plot of significant enrichment analysis for the top 20 metabolites from C. LC-SFA = long-chain saturated fatty acid; LC-MUFA = long chain monounsaturated fatty acid; NA = not applicable (not identified to the genus and/or species level). *A compound that has not been confirmed based on a standard, but that the analytical platform is confident in its identity.

