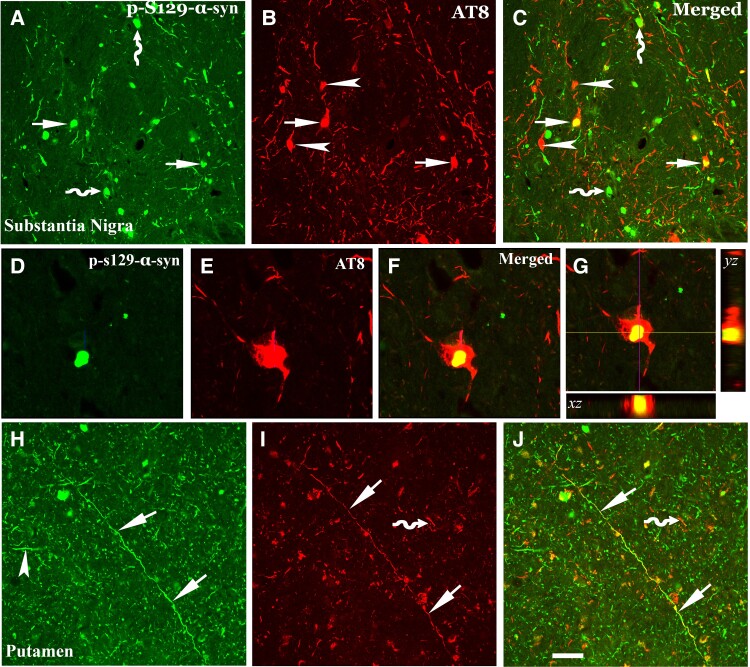
Figure 5.
Co-localization analyses of phosphorylated tau (AT8) and α–syn (p–S129–α–syn) in nigrostriatal system. Confocal microscopic images of substantia nigra (A–G) and putamen (H–J) illustrated p-S129-α-syn (green; A, D and H), AT8 (red; B, E and I) and co-localization of AT8 and p-S129 (merged; C, F, G and J). There were three populations of immunofluorescence-labelling aggregates: p-S129-α-syn and AT8 double-labelling (arrows; A–C), AT8 single-labelling (arrowhead; B and C) or p-S129-α-syn single-labelling (curved arrow; A and C). The p-S129-α-syn-labelled aggregate (D) deposited within AT8-labelled perikarya (E and F). 3D reconstruction of confocal image further illustrated the co-localization of labelled p-S129-α-syn and AT8 (G): the large panel represents a cross section of the cell layer; the horizontal (yellow) and vertical (pink) lines through them denote the planes of the adjoining xz and yz sections, respectively. Bottom and right: The xz and yz cross sections were obtained from the combined serial optical sections of these cell layers using Olympus Confocal Fluoroview software. The 3D reconstruction analyses revealed that p-S129-α-syn were co-localized with AT8 (yellow). In putamen p-S129-α-syn (arrowhead; H) and AT8-labelled threads and dots (curved arrow; I) were not co-localized, but the longer fibre with AT8 labelling was p-S129-α-syn immunopositive (arrows; H–J). Scale bar in J = 50 μm in H–J, 25μm in D–G, 100μm in A–C.

