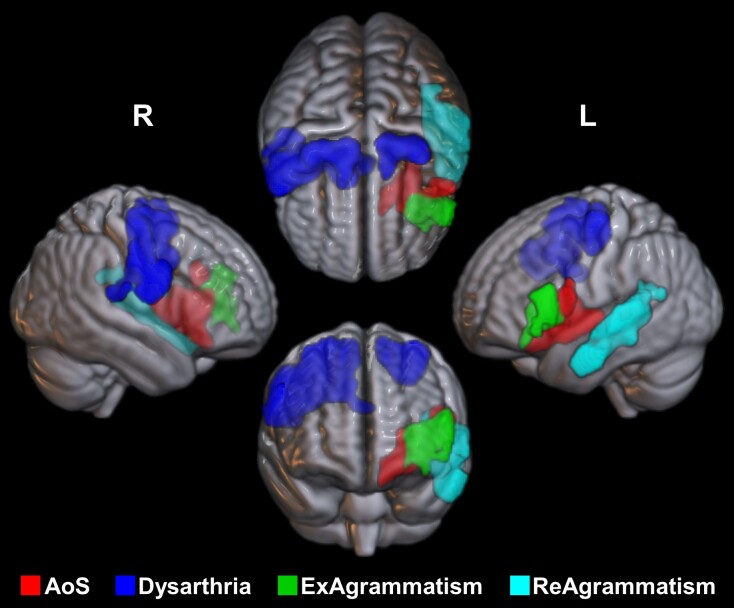
Figure 4.
3D volume rendering of thresholded statistical maps. The figure illustrates the relative location of the neural substrates of apraxia of speech (AoS) and dysarthria (both from VBM Analysis 1), as well as expressive (Ex) and receptive (Re) agrammatism (from VBM Analyses 2b and 3b, respectively). There was a confined area of overlap between the effects of AoS and expressive agrammatism within the deep left frontal operculum. L = left hemisphere; R = right hemisphere; VBM = voxel-based morphometry.

