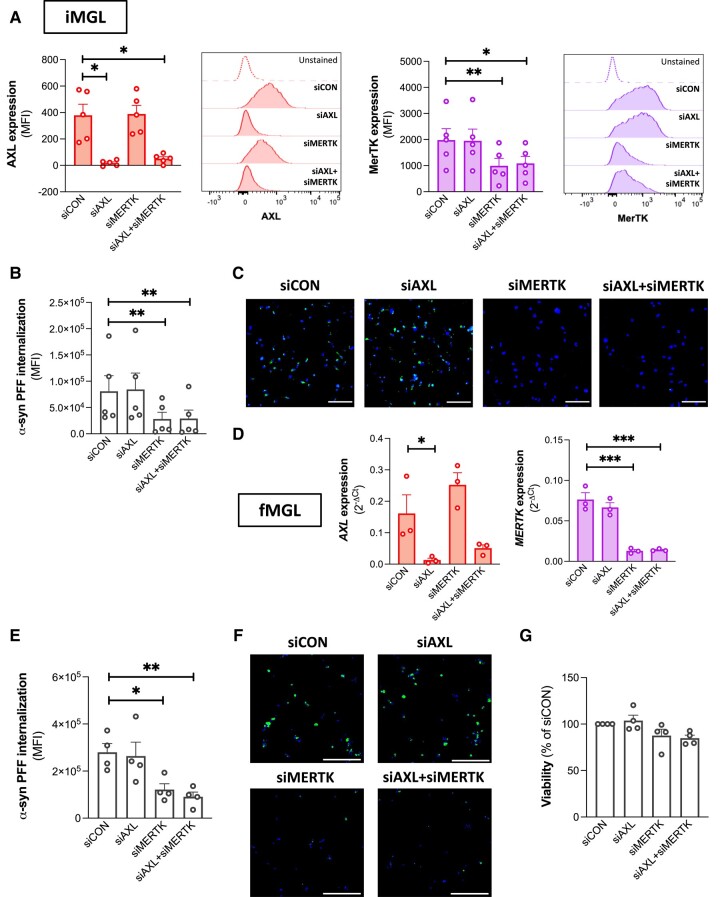
Figure 4.
Effect of AXL/MERTK knockdown on microglial uptake of α-synuclein preformed fibrils. Microglia were transfected with siCON, siAXL and/or siMERTK. (A) Cell surface expression of AXL and MerTK assessed by flow cytometry on live induced pluripotent stem cell-derived microglia (iMGL) 48 h following transfection. Repeated measure one-way ANOVA were performed followed by Dunnett’s post hoc test. Mean ± SEM of n = 5; *P < 0.05, **P < 0.01; MFI = median fluorescence intensity. (B) Quantification of mean green fluorescence intensity (MFI) in induced pluripotent stem cell-derived microglia (iMGL) culture challenged with pHrodoTM Green-labelled α-synuclein (α-syn) preformed fibrils (PFFs) for 2 h. A repeated measure one-way ANOVA was performed followed by Dunnett’s post hoc test. Mean ± SEM of n = 5; **P < 0.01. (C) Representative images of iMGL challenged with pHrodoTM Green-labelled α-syn PFFs for 2 h and counterstained with Hoechst 33342 (blue). Scale bar = 150 μm. (D) qRT-PCR assessment of AXL and MERTK expression in fetal microglia (fMGL) 48 h following transfection. Repeated measure one-way ANOVA were performed followed by Dunnett’s post hoc test. Mean ± SEM of n = 3; *P < 0.05, ***P < 0.001. (E) Quantification of mean green fluorescence intensity (MFI) in fMGL culture challenged with pHrodoTM Green-labelled α-syn PFFs for 2 h. A repeated measure one-way ANOVA was performed followed by Dunnett’s post hoc test. Mean ± SEM of n = 4; *P < 0.05, **P < 0.01. (F) Representative fluorescence images of fMGL challenged with pHrodoTM Green-labelled α-syn PFFs for 2 h and counterstained with Hoechst 33342 (blue). Scale bar = 200 μm. (G) Viability of fMGL 48 h following transfection. A repeated measure one-way ANOVA was performed followed by Dunnett’s post hoc test. Mean ± SEM of n = 4.

