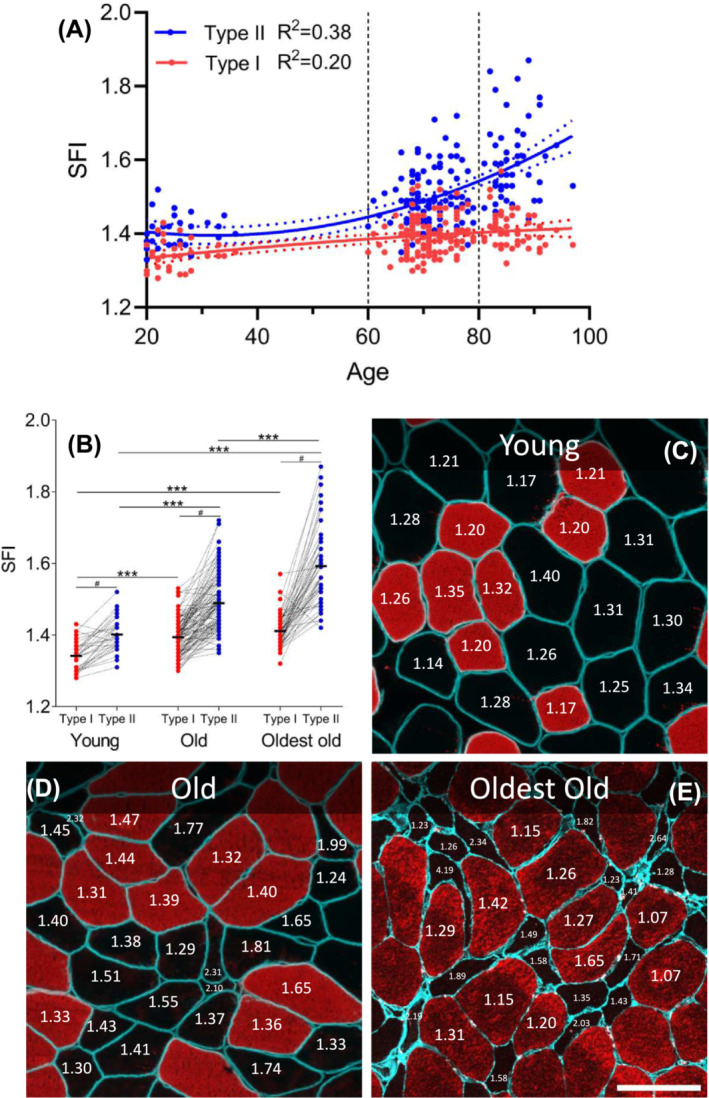
Figure 2.

Myofiber shape factor index (SFI) increases with ageing and in type II fibres. (A) Association between age and type I (red, P < 0.001) and II (blue, P < 0.001) myofiber SFI was determined by second‐order polynomial regression (solid line). Horizontal dashed lines indicate arbitrary separation into three age cohorts: young (n = 34), old (n = 111) and oldest old (n = 52). (B) Type I and II myofiber SFI for young, old and oldest old displayed as means, with connected individual values. Each data point represents one individual. Data were analysed using two‐way repeated measures analysis of variance (age group × fibre type), with significant main effects (P < 0.001) and interactions (P < 0.001). *** indicates effect of age group, P < 0.001. # indicates effect of fibre type, P < 0.001. (C–E) Representative examples of muscle biopsy cross‐sections from young (C), old (D) and oldest old (E), stained for dystrophin (C, D, cyan), laminin (E, cyan) and myosin heavy chain type I (C–E, red). SFI values are provided for selected fibres. Scale bar = 100 μm.
