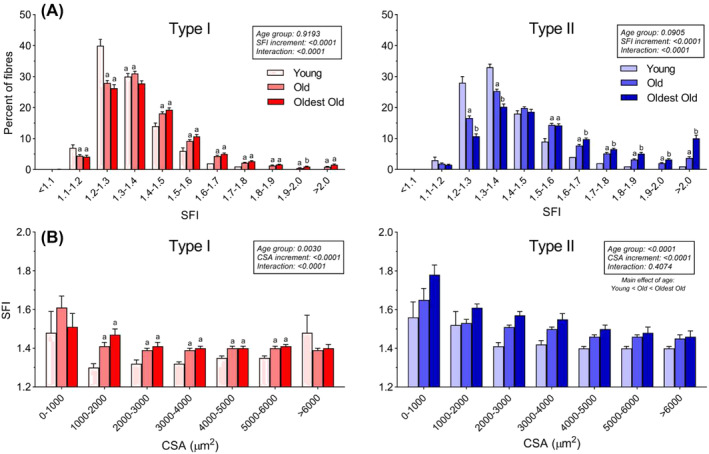
Figure 3.

Shape factor index (SFI) distribution. (A) Percentage of type I and II myofibers in 0.1 increments of SFI for young (n = 34), old (n = 111) and oldest old (n = 52). Data were analysed using two‐way repeated measures analysis of variance (age group × cross‐sectional area [CSA] increment), with main effects and interactions indicated in the figure. Results of the post hoc test are indicated by letters; bars that do not have the same letter are significantly different within the respective SFI increment (P < 0.05). (B) SFI of type I and II myofibers binned in 1000 μm2 CSA increments. Data are averages of all subjects within each age group and presented as means ± SEM. Data were analysed using mixed‐effects model (age group × CSA increment), with main effects and interactions indicated in the figure. Results of the post hoc test are indicated by letters; bars that do not have the same letter are significantly different within the respective CSA increment (P < 0.05). See Supporting Information S7 for details on the numbers of participants represented in each increment.
