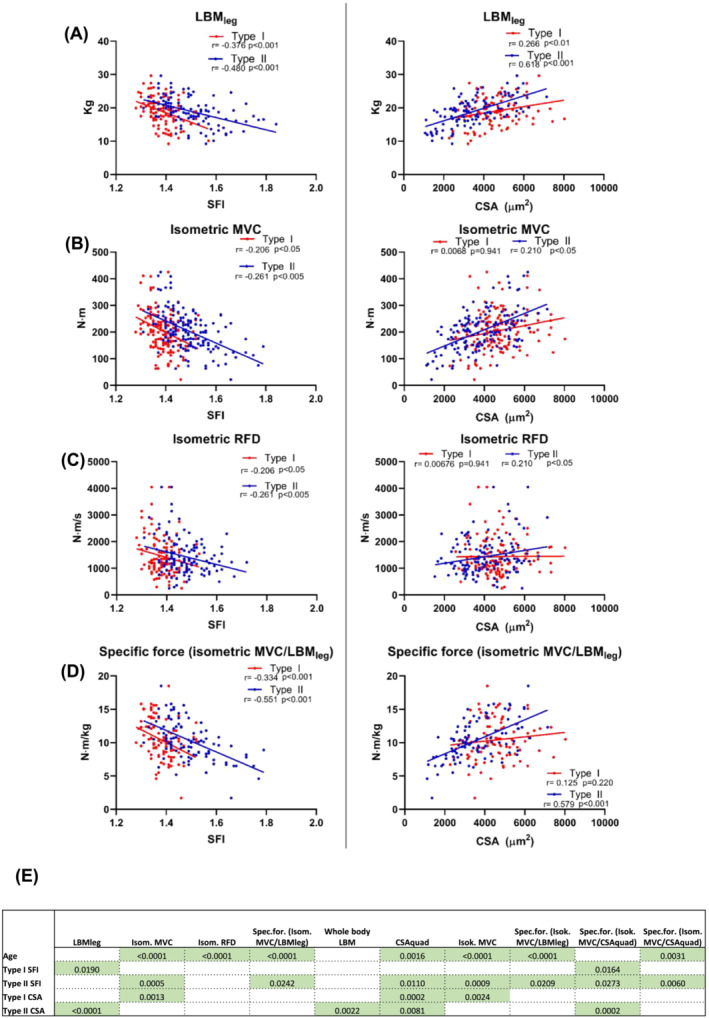
Figure 4.

Linear correlation analyses between shape factor index (SFI) (left) and cross‐sectional area (CSA) (right) for type I and II myofibers with in vivo measures of muscle mass and function. Each data point represents one individual, ranging in age from 20 to 94 years, and all in the untrained state. Strength of association is indicated by r and P‐values. Correlations are displayed for (A) leg lean mass (LBMleg) (n = 108), (B) isometric (Isom.) maximal voluntary contraction (MVC) (n = 150), (C) isometric rate of force development (RFD) (n = 123) and (D) specific force (Spec.for.) (MVC/LBMleg) (n = 98). (E) P‐values of the model parameters that were significant independent predictors of 10 indices of muscle mass and function. Refer to Supporting Information S11 for full outline of the multiple linear regression analyses. Additional correlations can be found in Supporting Information S10. Isok., isokinetic.
