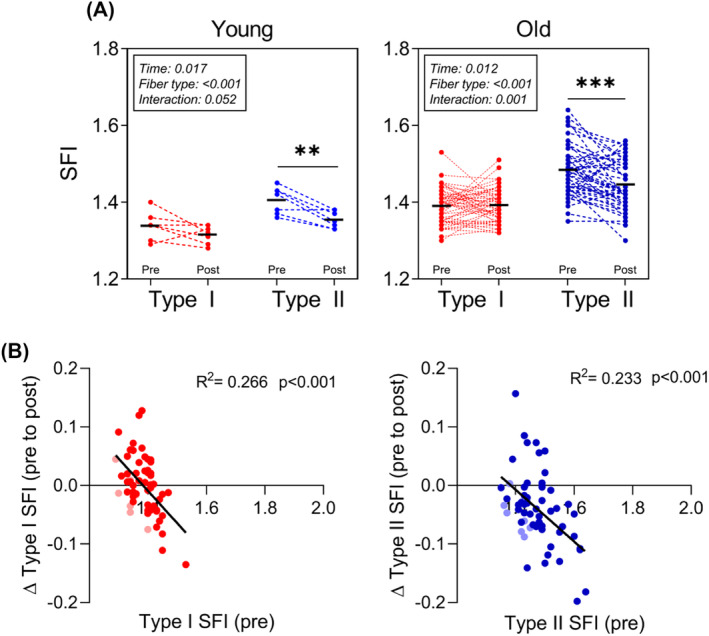
Figure 5.

Shape factor index (SFI) modification with resistance training (RT). (A) SFI for type I (red) and II (blue) myofibers before and after 3 or 4 months of RT. Data are presented for young (n = 7) and old (n = 52) and were analysed using two‐way repeated measures analysis of variance (time × fibre type) within each age group, with main effects and interactions indicated in the figure. **P < 0.01 post versus pre. ***P < 0.001 post versus pre. (B) Linear correlation analysis between SFI at baseline and changes following RT for type I (red) and II (blue) myofibers. Data are pooled young and old participants from A, and young is shown in faded colours. R 2 and P‐values are provided.
