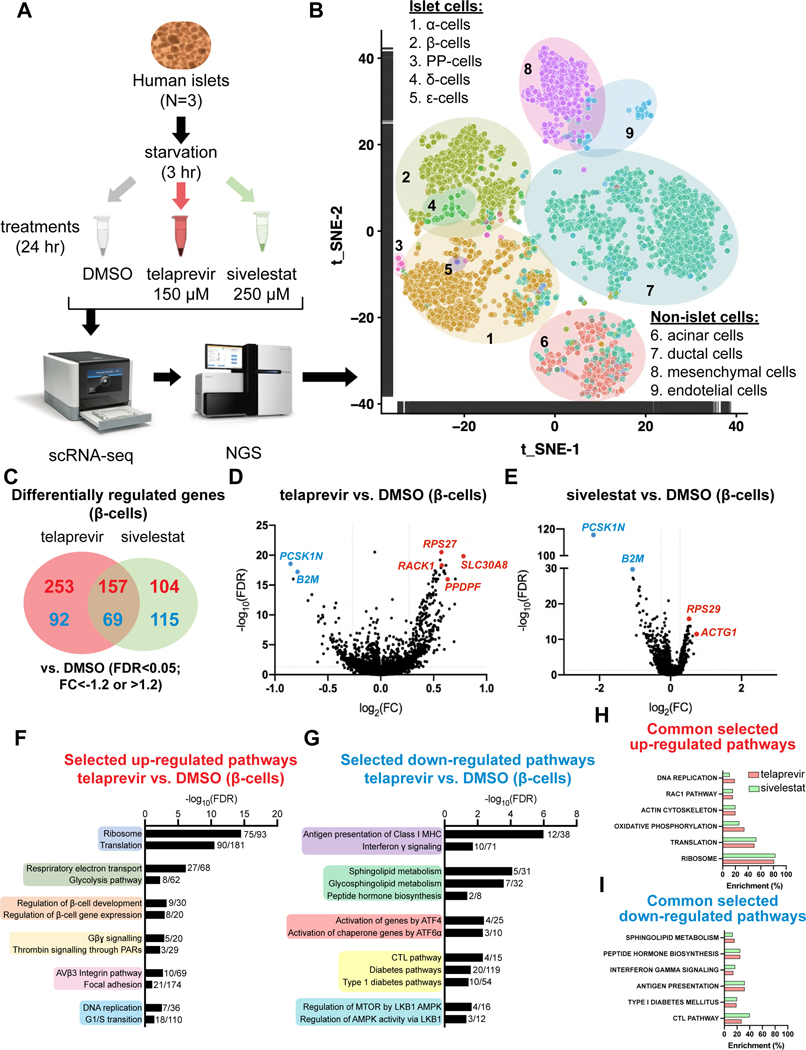
Figure 5: Transcriptomic changes in human β-cells regulated by telaprevir-dependent PE blockade.
(A) Experimental design of single-cell RNA-Sequencing (scRNA-Seq) experiments.
(B) Global t_SNE plot representing the dispersion of the high-quality cells including all the three experimental groups.
(C) Differentially up-regulated (in red) and down-regulated (in blue) genes in human islets treated with telaprevir (red circle) or sivelestat (green circle).
(D and E) Volcano plots of differentially regulated genes in (D) telaprevir and (E) sivelestat treated β-cells compared to DMSO.
(F and G) Selected differentially (F) up-regulated and (G) down-regulated pathways in human β-cells treated with telaprevir vs. DMSO.
(H and I) Selected differentially (H) up-regulated and (I) down-regulated pathways shared by β-cells treated with telaprevir and sivelestat. Data are percentage of enrichment of differentially regulated genes.

