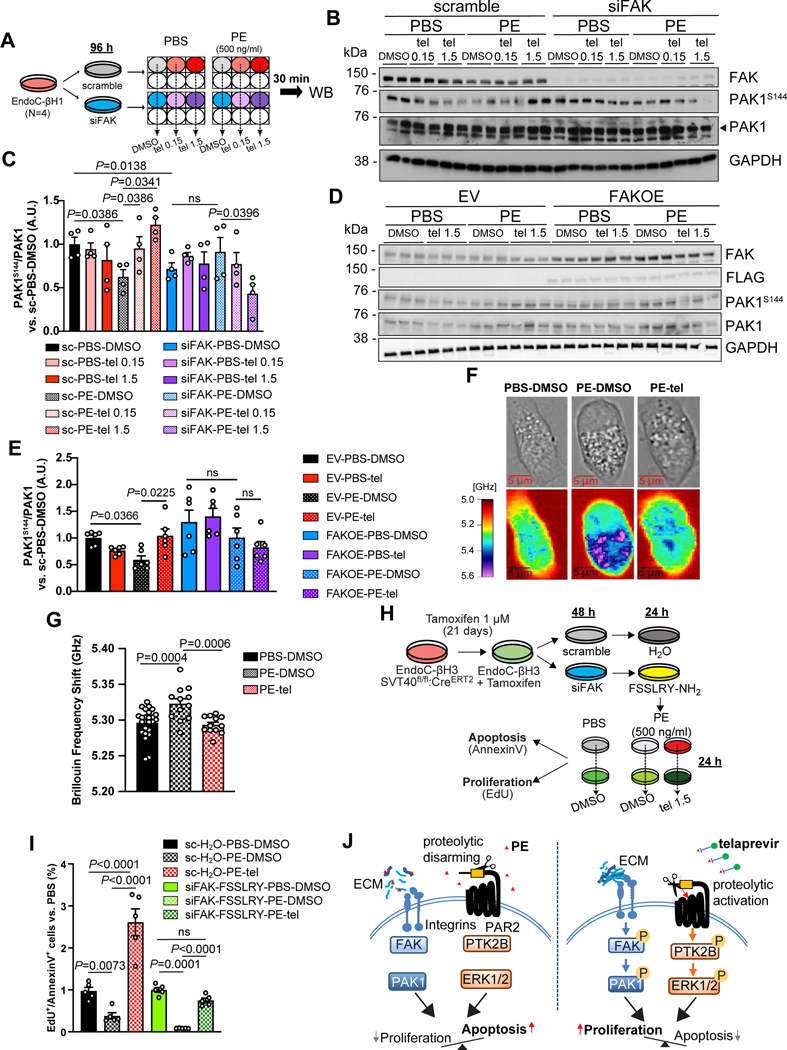
Figure 7. Effects of PE on the mechano-signaling pathway in human β-cells.
(A) Experimental scheme of stimulations in EndoC-βH1 cells to investigate the mechano-signaling pathway.
(B and D) Representative blots of phosphorylated and total PAK1 protein levels in EndoC-βH1 in which FAK expression was (B) down-regulated or (D) up-regulated and stimulated at the indicated conditions.
(C and E) Quantification of phospho-PAK1 levels from blots in (C) B and (E) D. Data are mean ± SEM. One-Way ANOVA test was used with Fisher’s LSD correction for multiple comparisons. Ns: non-significant.
(F) Representative brightfield (upper panels) and Brillouin imaging (lower panels) pictures of EndoC-βH1 cells treated with either vehicle solutions (PBS-DMSO, left panels) or PE (middle panels) or PE with telaprevir (right panels) for 24 hr. Brillouin shift heatmap is expressed in GHz and ranges from 5 (red, low stiffness) to 5.6 (purple, high stiffness).
(G). Quantification of Brillouin Frequency Shift from pictures in A Data are mean ± SEM. One-Way ANOVA test was used with Fisher’s LSD correction for multiple comparisons.
(H) Experimental design of viability assays in EndoC-βH3 cells upon treatments with PE in combination or not with telaprevir.
(I) Quantification of the EdU+/Annexin V+ cell ratio in EndoC-βH3 cells at the indicated conditions. Data are mean ± SEM. One-Way ANOVA test was used with Fisher’s LSD correction for multiple comparisons. Ns: non-significant
(J) Working model of the mechanism of action of telaprevir on β-cell viability by modulating the mechano-signaling and the PAR2 pathways.
See also Figure S7.

