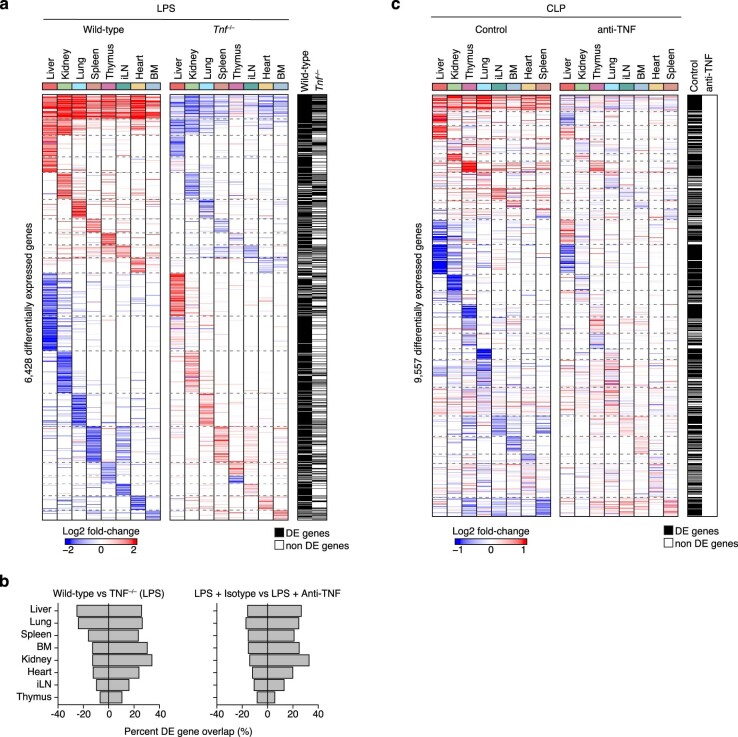
Extended Data Fig. 6. The Effect of TNF on the Transcriptional Responses of Organs across Bacterial Sepsis.
a, Heatmaps of differentially expressed genes (rows) from whole-tissue mRNA profiles ordered by k-means clustering and organ types (top, colors) at 0.5 day after sublethal LPS injection in wild-type (left) or Tnf − /− mice (right). Values are log2 fold-changes relative to matching organs from untreated mice for wild-type, or LPS-treated wild-type mice for Tnf − /−. Statistical analyses were performed with limma (FDR-adjusted p-value < 0.01, absolute fold change > 2, or FDR-adjusted p-value < 0.05, absolute fold change > 2). Shown are all the genes found to be differentially regulated in at least one of the indicated conditions (row annotations in black). BM, bone marrow; iLN, inguinal lymph node. b, Percentages (x axis) of genes differentially expressed in tissues (rows) upon sublethal LPS injection in Tnf − /− mice (left) or mice treated with anti-TNF antibodies (1 h prior to LPS; right) that match the genes regulated by LPS in wild-type mice. c, Heatmaps of differentially expressed genes (rows) from whole-tissue mRNA profiles ordered by k-means clustering and organ types (top, colors) at 0.5 day after cecal ligation and puncture (CLP) with pre-treatment with anti-TNF (right) or isotype control (left) antibodies. Values are log2 fold-changes relative to matching organs from sham operated mice for CLP with isotype control antibodies, or CLP operated mice for CLP with anti-TNF antibodies. Statistical analyses were performed with limma (FDR-adjusted p-value < 0.1, or FDR-adjusted p-value < 0.1). Shown are all the genes found to be differentially regulated in at least one of the indicated conditions (row annotations in black).

