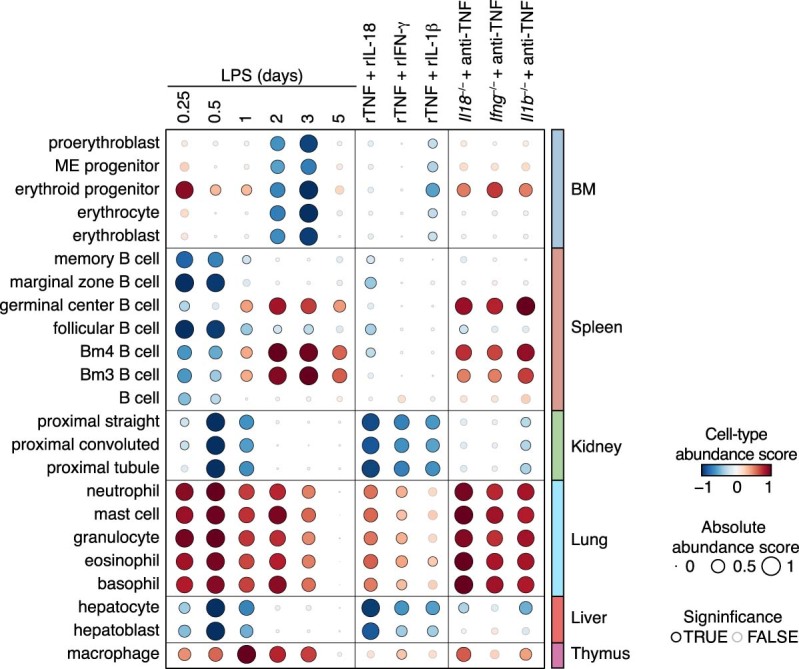
Extended Data Fig. 10. The Effects of perturbation on Cell Type Abundance Scores Computed from Whole-Tissue Gene Expression Profiles.

Cell type abundance scores computed for indicated cell types (row) upon injection of a sublethal dose of LPS in wild-type (left) or indicated knockout animals pre-treated with indicated neutralizing antibodies (right) or injected with indicated recombinant cytokine pairs (center) (columns). BM, bone marrow.
