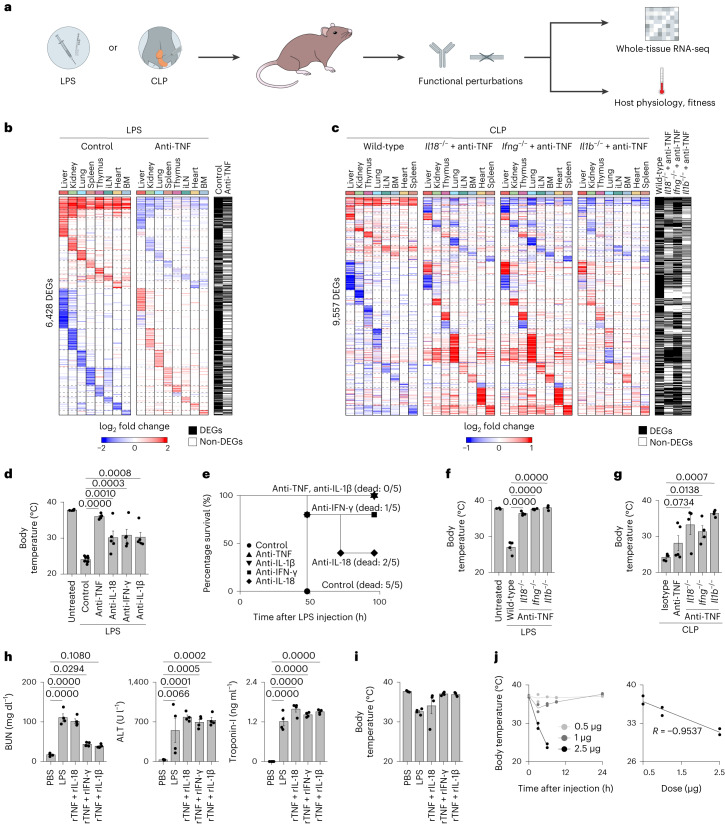
Fig. 4. Cytokine pairs explain the physiological and fitness effects of sepsis.
a, Schematic overview of the experimental workflow. The impact of cytokine perturbations using neutralizing antibodies and genetic deletions during LPS or CLP sepsis was assessed by measuring tissue gene expression and host physiological parameters. b, Heat maps of DEGs (rows) from whole-tissue mRNA profiles ordered by k-means clustering and organ types (top; colors) at 12 h after sublethal LPS injection with or without (control) anti-TNF pretreatment. Values are log2 fold changes relative to matching organs from untreated mice for LPS without anti-TNF. Statistical analyses were performed with limma (FDR-adjusted P value < 0.01–0.05, absolute fold change > 2). Shown are all the genes found to be differentially regulated in at least one of the indicated conditions (row annotations in black). BM, bone marrow; iLN, inguinal lymph node. c, Heat maps of DEGs (rows) from whole-tissue mRNA profiles ordered by k-means clustering and organ types (top, colors) at 0.5 d after CLP (severe grade) in wild-type mice injected with isotype control antibodies or Il18−/−, Ifng−/− or Il1b−/− mice injected with anti-TNF (left to right). Values are log2 fold changes relative to matching organs from sham-operated mice for wild-type, or wild-type mice after severe CLP surgeries for Ifng−/−, Il18−/− and Il1b−/− mice. Statistical analyses were performed with limma (FDR-adjusted P value < 0.1). Shown are all the genes found to be differentially regulated in at least one of the indicated conditions (row annotations in black). d, Measurements of rectal temperature in mice of indicated genotypes with or without indicated neutralizing antibody pretreatment at 24 h after lethal LPS injection. Statistical differences were determined by one-way analysis of variance (ANOVA) with Tukey–Kramer test. Error bars indicate the s.e.m. (n = 10 biologically independent samples for LPS control; n = 5 biologically independent samples for other groups). e, Survival curves of mice injected with a lethal dose of LPS with or without indicated neutralizing antibody pretreatment (n = 5 biologically independent samples). f,g, Measurements of rectal temperature in mice of indicated genotypes with or without indicated neutralizing antibody pretreatment at 0.5 d after lethal LPS injection (f) or severe CLP surgery (g). Statistical differences were determined by one-way ANOVA with Tukey–Kramer test. Error bars indicate the s.e.m. (n = 4 biologically independent samples). h, Serum levels of indicated organ injury markers at 24 h after injection of a sublethal LPS dose or PBS as control, or 12 h after injection of indicated recombinant cytokine pairs. Statistical differences were determined by one-way ANOVA with Tukey–Kramer test. Error bars indicate the s.e.m. (n = 4 biologically independent samples). ALT, alanine transaminase; BUN, blood urea nitrogen. i, Measurement of rectal temperature at 16 h after injection of a sublethal LPS dose, indicated cytokines or PBS as control. Error bars indicate the s.e.m. (n = 4 biologically independent samples). j, Measurements of rectal temperature (y axis; left and right) relative to time after injection (left) or varying doses (right, x axis) of recombinant (r)IL-1β in combination with rTNF (1 µg). Error bars indicate the s.d. (n = 2 biologically independent samples).

