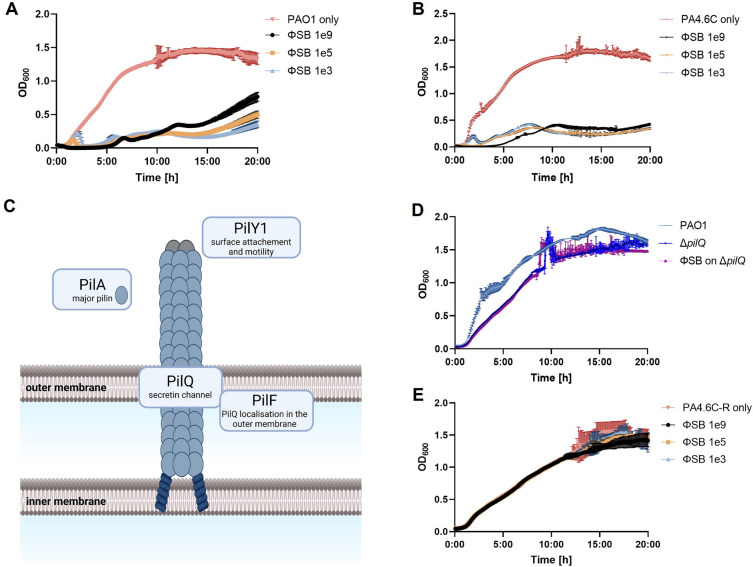
Figure 3.
Growth kinetic changes. (A) Growth curve of PAO1 with ΦSB at MOI ~ 1000 (1e9 PFU/mL), ~ 0.1 (1e5 PFU/mL) and ~ 0.001 (1e3 PFU/mL), n = 6. (B) Growth curve of PA4.6C with ΦSB at MOI ~ 30 (1e9 PFU/mL), ~ 0.003 (1e5 PFU/mL) and ~ 0.00003 (1e3 PFU/mL), n = 6. (C) Simplified schematic illustration of the type-IV pili and the pilus genes tested in this study. Created with Biorender.com and based on61–64. (D) Growth curve of PAO1 and knockout strain ΔpilQ with ΦSB at MOI ~ 1000 (1e9 PFU/mL), n = 4–6. (E) Growth curve of PA4.6C-R with ΦSB at MOI ~ 700 (1e9 PFU/mL), ~ 0.07 (1e5 PFU/mL) and ~ 0.0007 (1e3 PFU/mL), n = 6.

