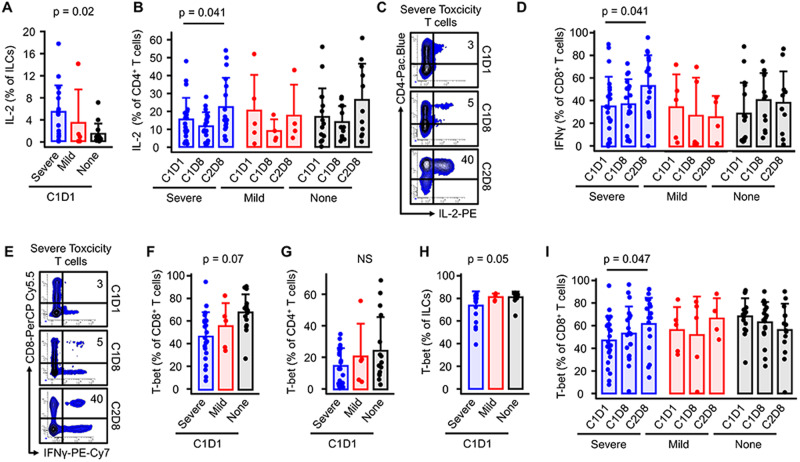
Fig. 3. Relationship between immune cell phenotype and immune-mediated toxicity.
Mononuclear cells isolated from peripheral blood collected before treatment (C1D1) and at 5 weeks (C2D8) were analyzed by flow cytometry. Patients were categorized based on their CTCAE grade of immune-mediated toxicity into Grade 1–2 (mild) (n = 5), Grade 3–5 (severe) (n = 24), and no immune-mediated toxicity (none) (n = 19). Results are expressed as mean + SEM, one-sided paired t test. Gating started is shown in supplementary Fig. 1A. One representative dot plot from each time point is shown. Source data are provided as a Source Data file.

