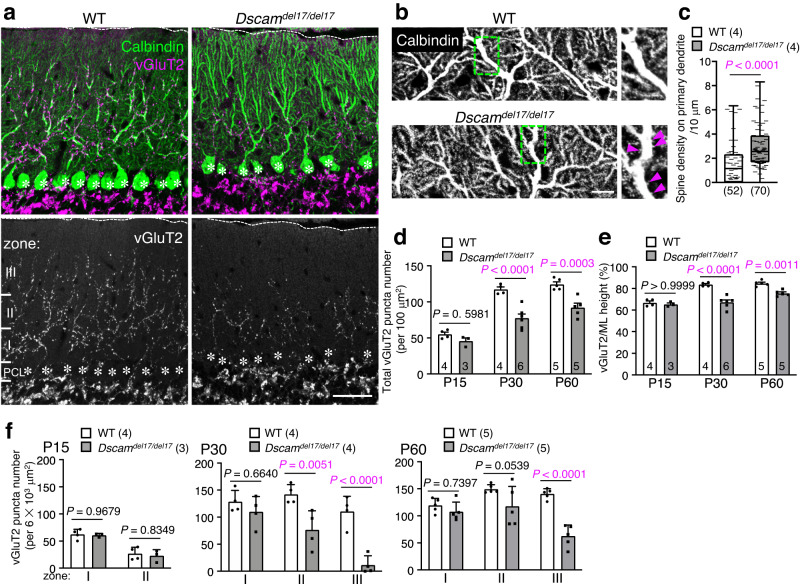
Fig. 2. Regressed CF territory and decreased CF synapses in Dscamdel17/del17 cerebella.
a Immunohistochemistry of Calbindin and vGluT2 in P30 wild-type (WT) (left) and Dscamdel17/del17 (right) mouse cerebellum. Dotted lines and asterisks represent the pial surface and Purkinje cell soma, respectively. The molecular layer located at the upper area of the Purkinje cell layer (PCL) was divided into three areas in f: Zone I was up to 40 µm in height from the PCL; Zone II was from 40 µm to 80 µm in height; Zone III was above 80 µm in height. Scale bar, 50 µm. b Immunohistochemistry of Calbindin in P30 WT (upper) and Dscamdel17/del17 (lower) mouse cerebellum. The boxed regions are enlarged in the right images. Pink arrowheads represent ectopic spines from proximal dendrites. Scale bar, 50 µm. c The density of spines on the primary dendrites per 10 µm dendrite length. WT, N = 4 mice, n = 52 dendrites; Dscamdel17/del17, N = 4 mice, n = 70 dendrites, box plots show median (horizontal line), quartiles (box), and range (whiskers), two-tailed Mann-Whitney test. d Developmental changes in the total vGluT2 puncta number per 100 µm2. The numbers in each column indicate the number of mice examined. Data represent mean ± SEM; Two-way ANOVA with multiple comparisons. e Developmental changes in the ratio of vGluT2 height per height of molecular layer (ML). The numbers in each column indicate the number of mice examined. Data represent mean ± SEM; Two-way ANOVA with multiple comparisons. f Developmental and regional changes in the total number of vGluT2 puncta per 6103 µm2. The zone was represented in a. Data represent mean ± SEM; Two-way ANOVA with multiple comparisons.

