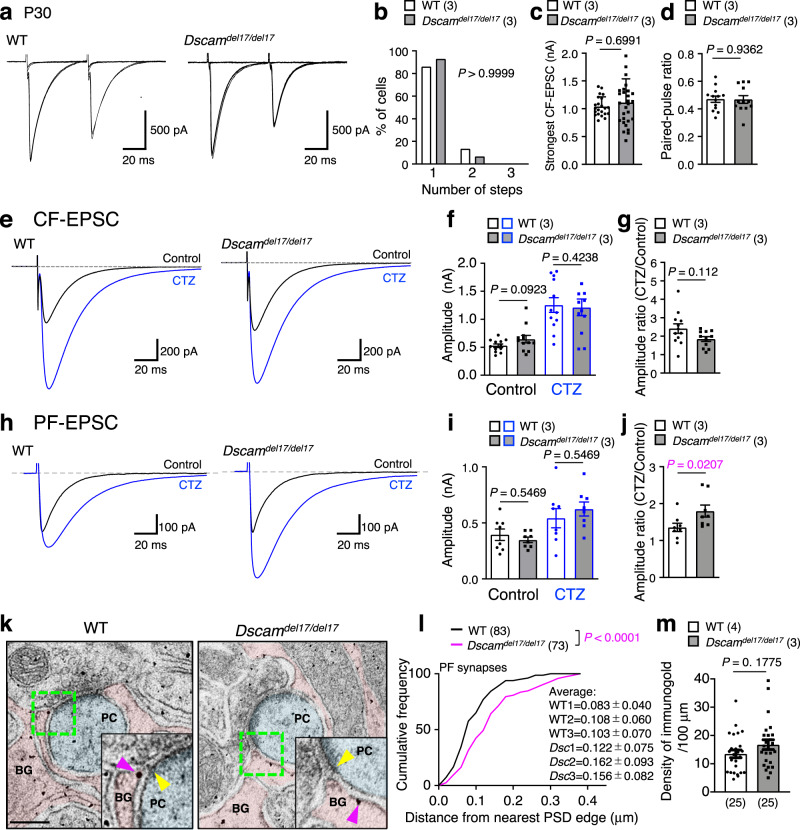
Fig. 3. Hypofunction of GLAST in PF synapse in Dscamdel17/del17 mouse.
a Representative traces of stimulated CF-EPSCs from P30 cerebellar slices in adult WT (left) and Dscamdel17/del17 (right) mice. Superimposition of CF-EPSCs evoked by various stimulus intensities. CF: climbing fibre. b Frequency distributions of the number of CFs innervating each Purkinje cell at P30. The numbers in parentheses are mice count. Two-tailed Wilcoxon matched-pairs signed rank test. Strongest CF-EPSC amplitudes (c) and the paired-pulse ratio (d) from P28–32. The numbers in parentheses are mice count. Statistical analysis was performed using data from each neuron indicated by the dots in the graph. Data represent mean ± SEM with individual data from each neuron (c WT, n = 22; Dscamdel17/del17, n = 29, d WT, n = 13; Dscamdel17/del17, n = 12); two-tailed Mann-Whitney U test. Datasets of CF-EPSCs (e–g) and PF-EPSCs (h–j). Representative traces of EPSCs (e and h), amplitude (f and i), and amplitude ratio (g and j) from P28–32. The numbers in parentheses are mice count. Statistical analysis was performed using data from each neuron indicated by the dots in the graph. Data represent mean ± SEM with individual data from each neuron (f–g, WT, n = 12; Dscamdel17/del17, n = 12, i–j, WT, n = 8; Dscamdel17/del17, n = 8); two-tailed Mann-Whitney U test (f–g, i–j). PF-EPSC: parallel fibre-evoked excitatory postsynaptic current. CTZ: cyclothiazide. CF-EPSC: climbing fibre-evoked excitatory postsynaptic current. k, Immunoelectron microscopy of WT and Dscamdel17/del17 mouse molecular layer. Bergmann glial (BG) processes and dendritic spines of Purkinje cells (PC) are tinted pink and light blue, respectively. Higher magnification in the bottom-right corner represents the area surrounded by the green dotted box. The nearest postsynaptic density (PSD) edge and closest GLAST labelled with immunogold are indicated by yellow and pink arrowheads, respectively. Scale bar, 200 nm. l, Cumulative histogram of the distance between nearest PSD edge to closest GLAST labelled by immunogold in PF synapse. Samples were collected from three littermates per genotype. WT, n = 86 PSD edges; Dscamdel17/del17, n = 75 PSD edges. Unpaired two-tailed t-test. m, The density of GLAST labelled by immunogold. WT, N = 4 mice, n = 25 Bergmann glia; Dscamdel17/del17, N = 3 mice, n = 25 Bergmann glia. Statistical analysis was performed using data from each neuron indicated by the dots in the graph. Data represent mean ± SEM; two-tailed Mann-Whitney U test.

