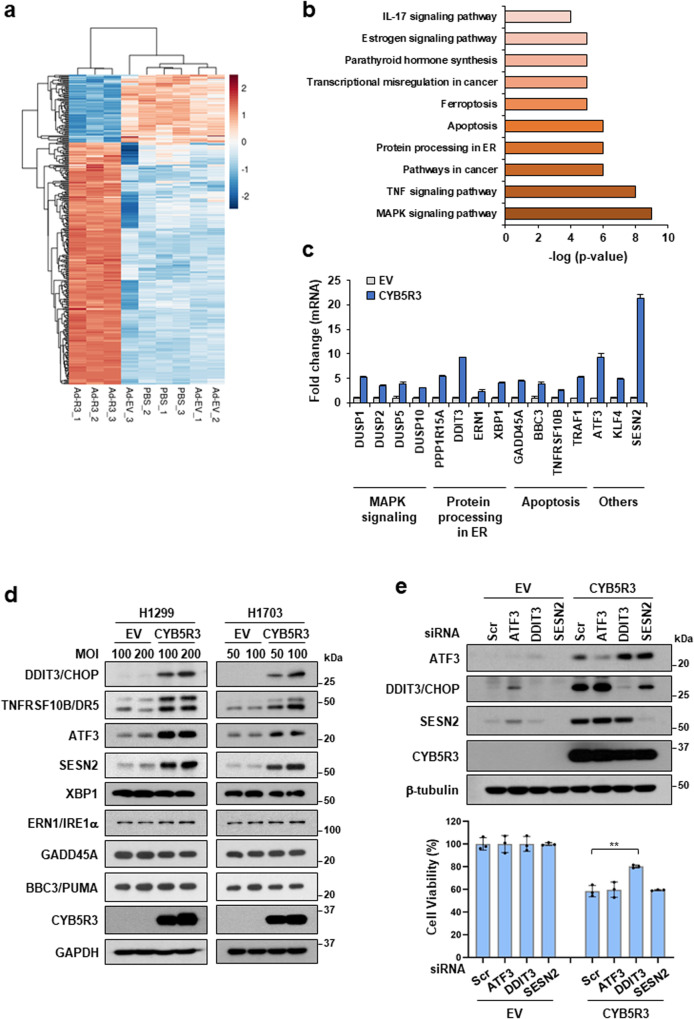
Fig. 3. CYB5R3 drives changes in gene expression profiles.
a–c RNA-seq analysis in H1299 cells infected with EV (Ad-EV) and CYB5R3 (Ad-CYB5R3). a Heatmap showing the differentially expressed genes (DEGs) from three independent samples treated with CYB5R3 compared with EV or PBS. b KEGG pathway enrichment analysis of the DEGs. The top twenty pathways are shown. c QPCR analysis of the indicated genes in H1299 cells infected with CYB5R3 for 24 h. d Immunoblot analysis of proteins with altered expression in H1299 or H1703 cells infected with CYB5R3 for 24 h. e H1299 cells were transfected with the indicated siRNA and infected with CYB5R3 for 48 h. Cell viability was measured by an SRB assay (lower panel). Immunoblot analysis was performed to measure the indicated protein levels (upper panel). The experiments were repeated three times. The data are shown as the means ± SDs. Student′s t test. **P < 0.01.

