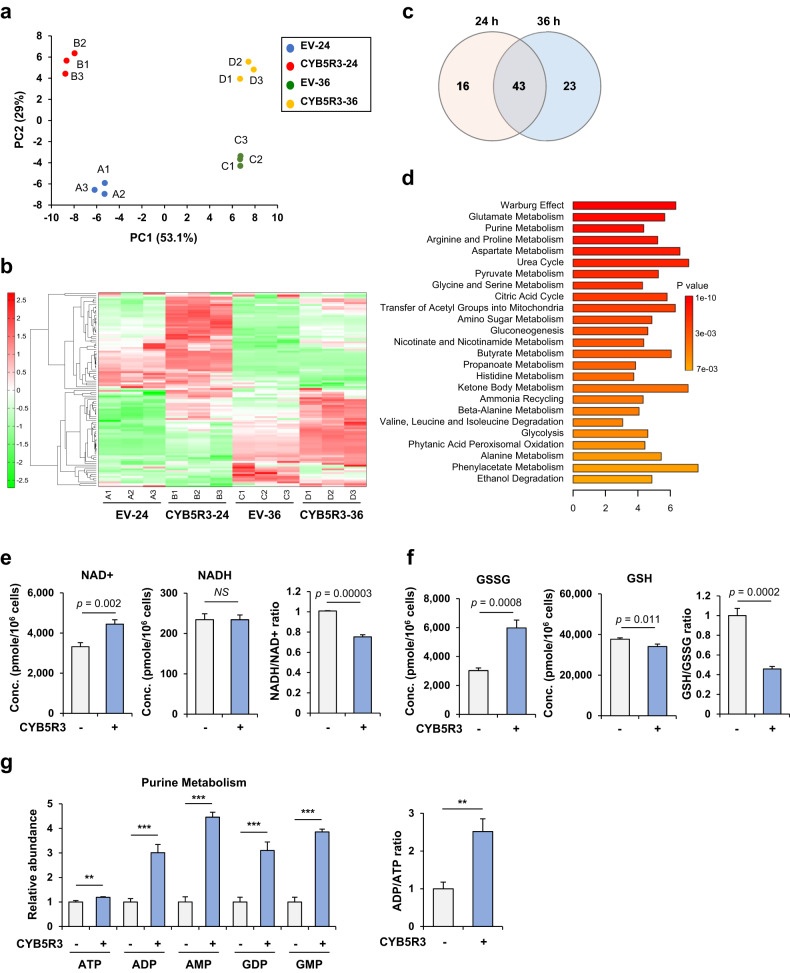
Fig. 5. CYB5R3 leads to metabolic alterations.
Metabolomic analysis in H1299 cells infected with EV or CYB5R3 at an MOI of 100 for 24 h or 36 h. a Principal component analysis (PCA) with three independent samples of the four groups infected with A. EV for 24 h, B. CYB5R3 for 24 h, C. EV for 36 h, or D. CYB5R3 for 36 h. b Heatmap showing the metabolites with statistically significant differences in abundance in three independent samples in CYB5R3-infected versus EV-infected cells. c Venn diagram showing the number of altered metabolites in cells infected with EV vs. CYB5R3 for 24 h or 36 h. d Enrichment analysis of the metabolites with statistically significant differences in abundance between cells infected with EV and CYB5R3 for 24 h. e–g Concentrations of altered metabolites in cells infected with CYB5R3 compared to EV for 24 h. *P < 0.05, **P < 0.01, ***P < 0.001.

